Has the price of crude oil become more or less volatile over time? Gleaning at the news, it would seem that the price has become significantly more volatile with, perhaps, the growing number speculators to blame. Let’s take a look at the data.
Let’s take a look at the inflation adjusted monthly (1979-2014) and daily (1987-2014) oil prices (adjusted for inflation). The time period for the monthly and daily price data is based on the availability of data.
Figure 1. Historical Inflation-Adjusted Brent Crude Oil Prices
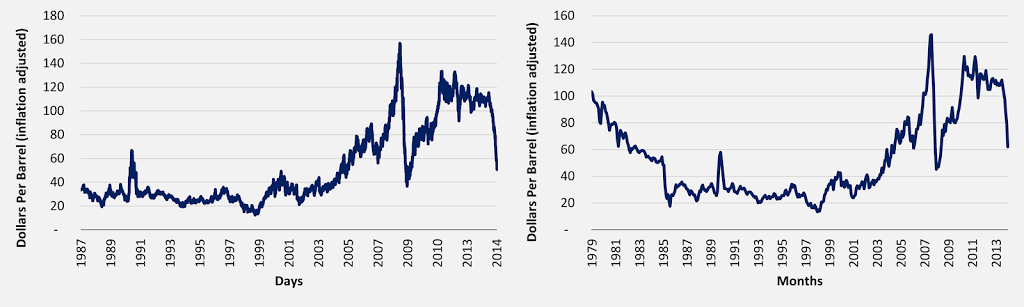
Source: The World Bank (monthly data), Energy Information Administration (daily data)
At first glance, the magnitude of price changes does appear to have increased on an inflation adjusted basis during each charts’ respective timeline. However, we can actually quantify price volatility by measuring the standard deviation.
We can quantify price volatility by looking at the standard deviation of changes in the oil price over a specified period of time. For example, we can calculate the monthly volatility over the course of a year by taking the standard deviation of the 12 monthly price changes during that particular year. The standard deviation measures the amount of variation around an average. A low standard deviation indicates that the data points (i.e., the 12 monthly changes) tend to be very close to the average monthly change (meaning less month-to-month variability); a high standard deviation indicates that the data points are spread out over a large range of values (meaning more month-to-month variability). We can interpret a higher standard deviation as higher volatility and lower standard deviation as lower volatility.
Let’s look at the rolling standard deviation of monthly and daily changes in a year.
Figure 2. Rolling Standard Deviation of Price Changes Per Year
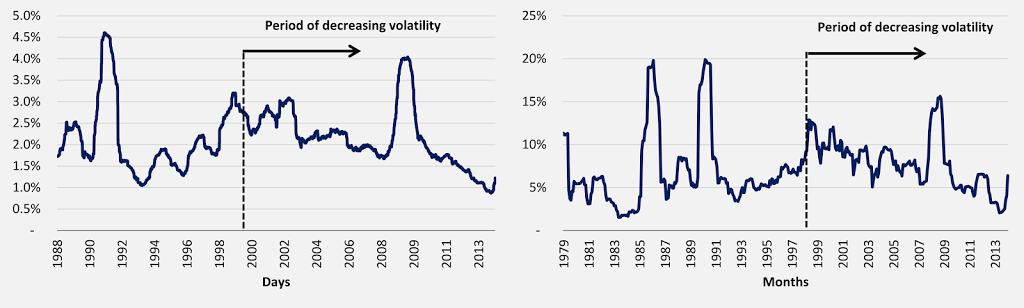 |
| Source: The World Bank (monthly data), Energy Information Administration (daily data) |
The data shows that both the daily and the monthly volatility have generally been decreasing since 2000 after a period of growing volatility before that. In fact, volatility reached a record low in 2014 (based on the available historical data).
However, as we saw in the “Measuring Brent Price Volatility in December 2014” write-up, the monthly price of oil has decreased by greater than 20 percent in just five instances since 1987, all five since the year 2000. While monthly and daily price volatility in general has been decreasing during the last few few decades, there has been a number of rapid and large price decreases.