Previously, chart-it observed that US coal consumption was in a multi-year decline but that US coal exports were up substantially. In this long overdue follow-up, we’ll review the state of US coal since 2014.
Let’s start by revisiting US coal consumption through September 2017 and exports through June 2017, the latest date for which information is available. Figure 1 below shows the change in US coal consumption and exports from 2001 on a trailing 12-month basis.
US coal consumption has continued to fall at a rapid pace. In 2014, annual US coal consumption had fallen by about 120 million short tons compared to 2001. By 2017, consumption had fallen by nearly 300 million short tons compared to 2001. The decline shows no sign of abating. In fact, despite Trump’s bluster about supporting the coal industry, US coal consumption during Obama’s last year in office was slightly higher than it’s been during Trump’s first year (since we only have data through September 2017, our analysis consider the 12-month period ending in September 2017).
Back in 2015, we also observed that the decline in US coal consumption was partially offset by a significant increase in exports because of higher demand from Europe, South Korea, India, Mexico, Brazil, and Turkey (the latest data we had for coal exports at the time was through 2013). Between 2013 and 2016, US coal exports declined substantially, nearly 100 million short tons per year, back to the level of exports in 2001.
To the delight of coal miners, however, coal exports started to creep back up in 2016 while US consumption remained flat/slightly lower. Who, exactly, can coal country thank for the improved demand for US coal?
Figure 1. Change in US Coal Consumption and Exports Since 2001 (Trailing 12-Months, Million Short Tons)
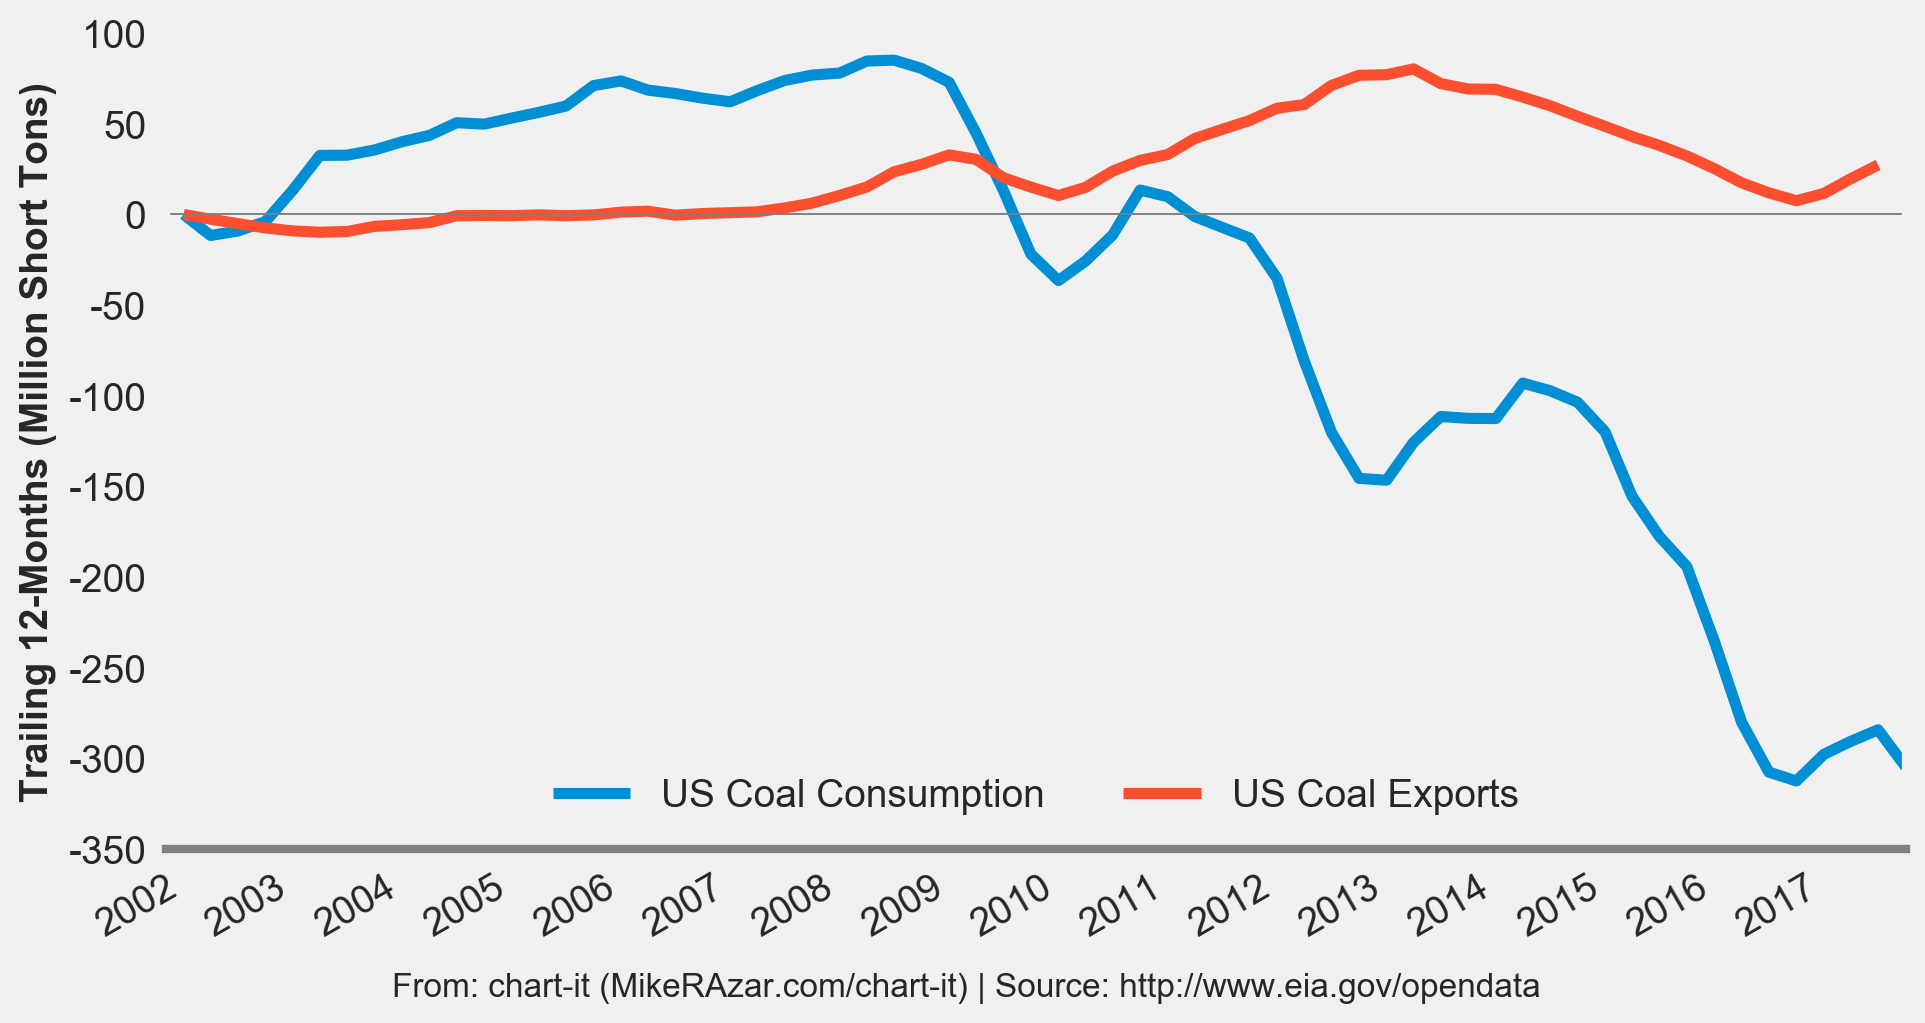
Figure 2 shows the amount of coal that the US exports to its largest customers. (No, the Netherlands doesn’t consume that much coal – the ports at Rotterdam and Amsterdam are major transshipment points for coal to other European countries.) Many of the US’s largest customers have reduced their imports significantly since 2013, but there was a rebound starting in the second half of 2016. So which countries increased their imports the most since 2016?
Figure 2. Trailing 12-Months of US Coal Imports (Million Short Tons)
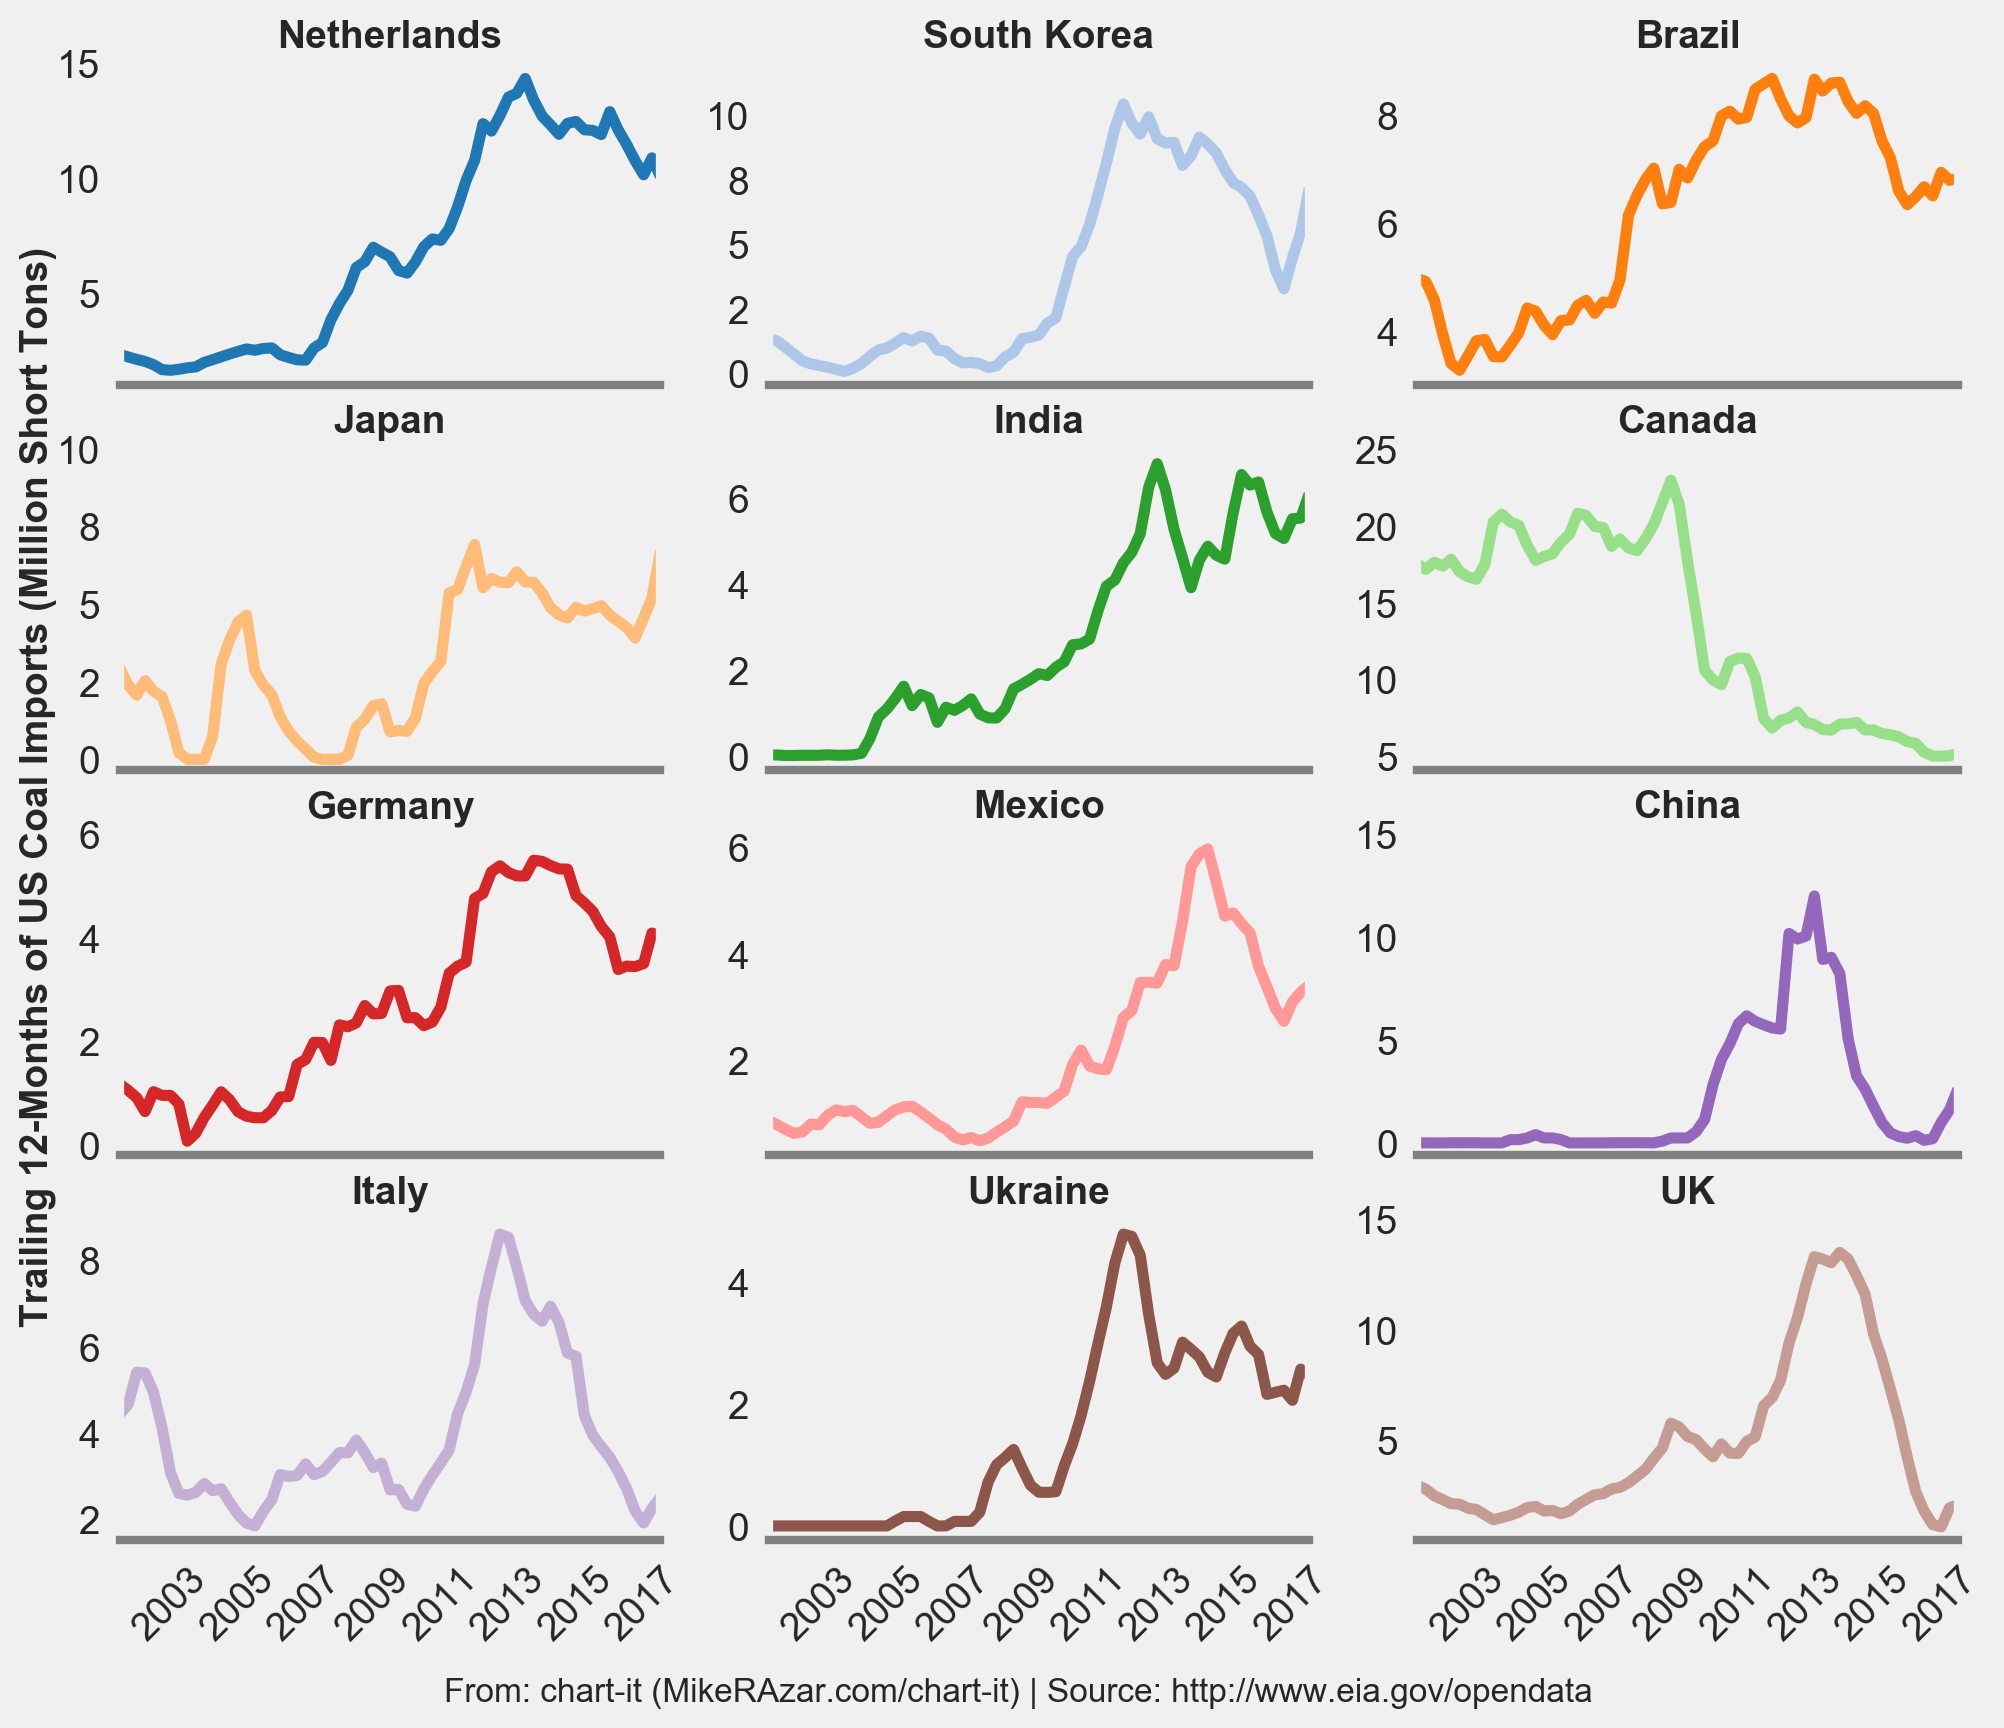
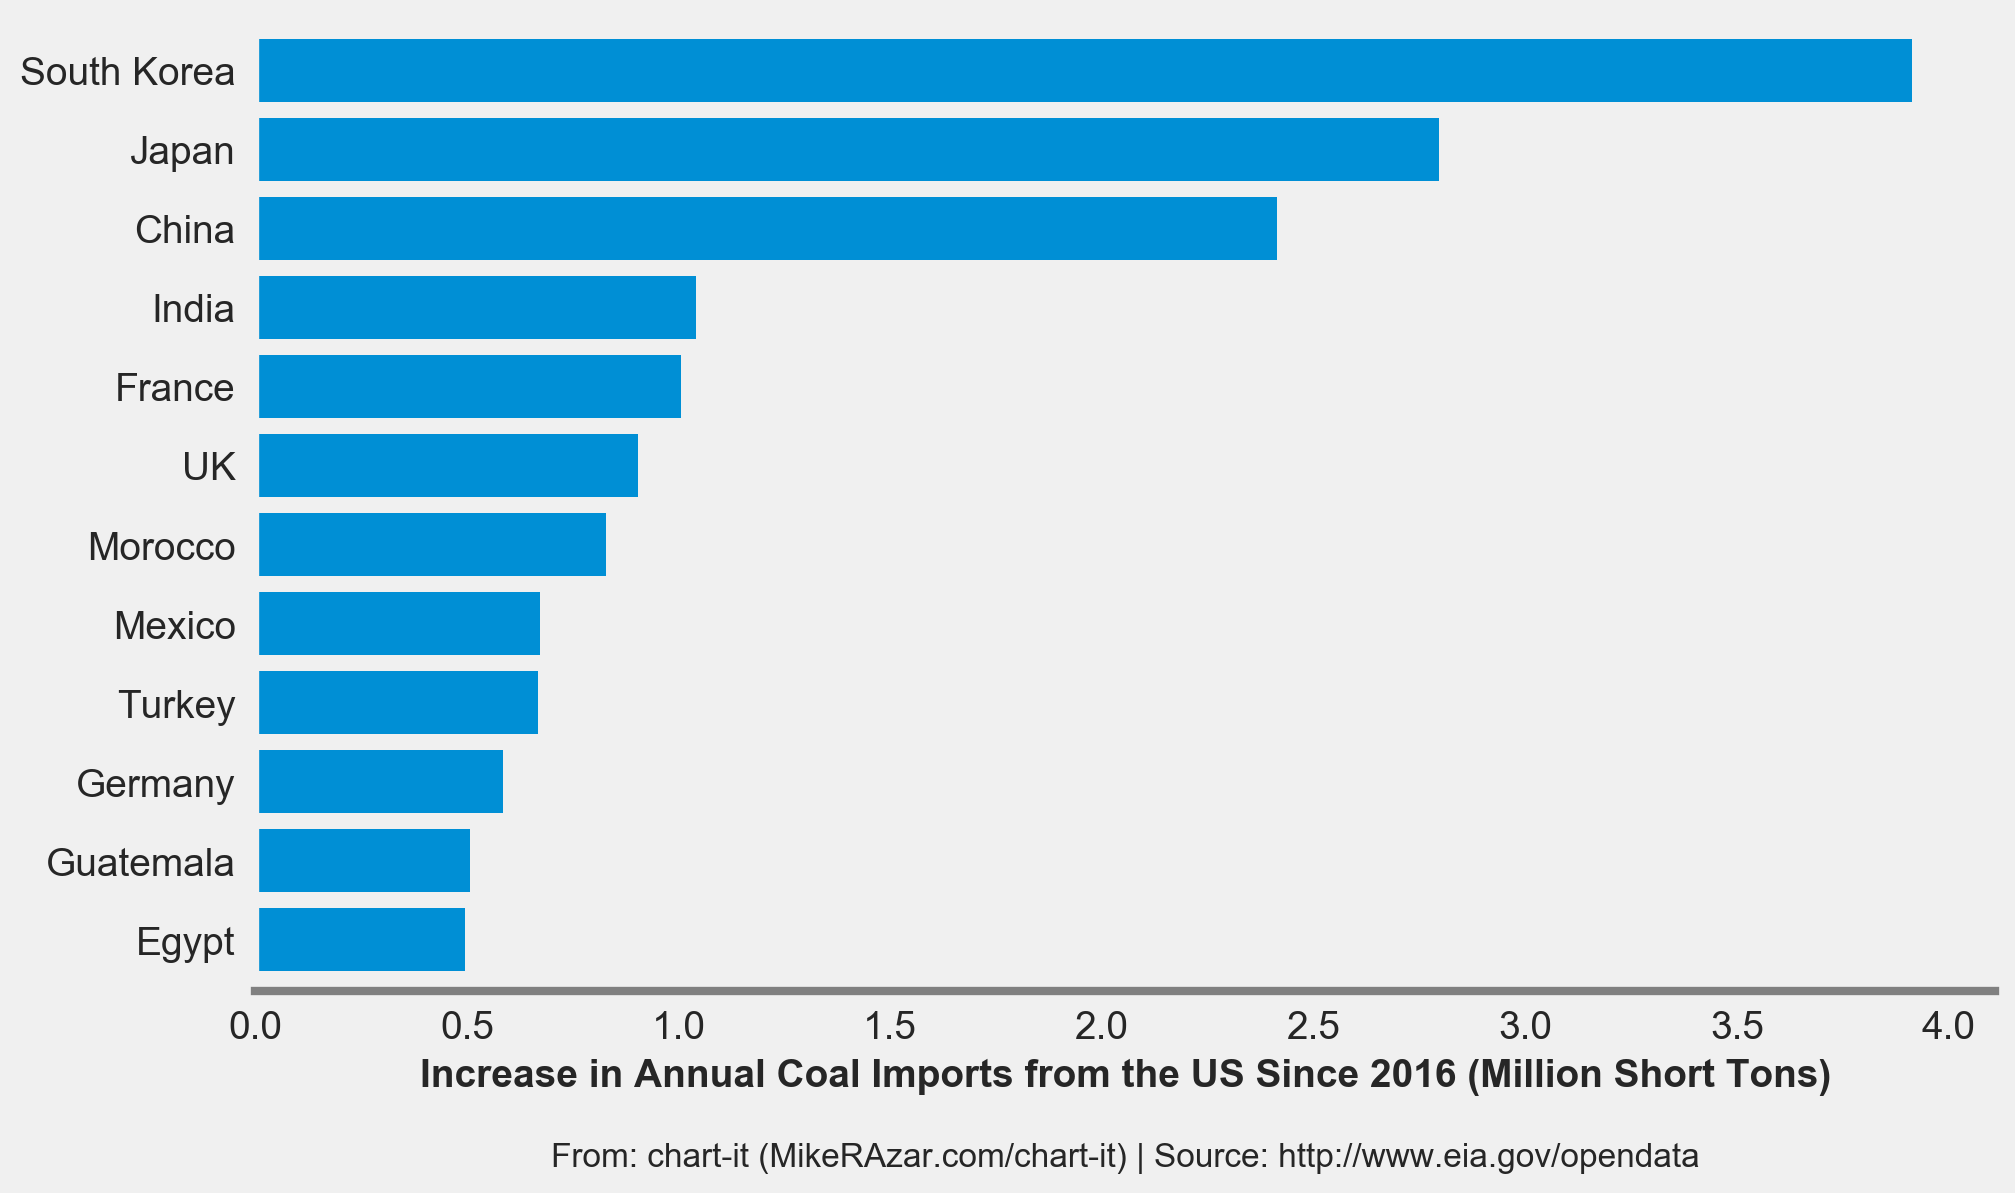
Figure 3 shows the increase in annual US coal imports between 2016 and 2017 for those countries whose demand grew the most during this period. South Korea, Japan, and China account for the vast majority of the demand growth.
South Korea , Japan, and China, together, accounted for 44% of the growth in US coal export demand during this period. That’s nearly 10 million short tons per year.
Figure 3. Increase in Annual Coal Imports from the US Since 2016 (Million Short Tons)
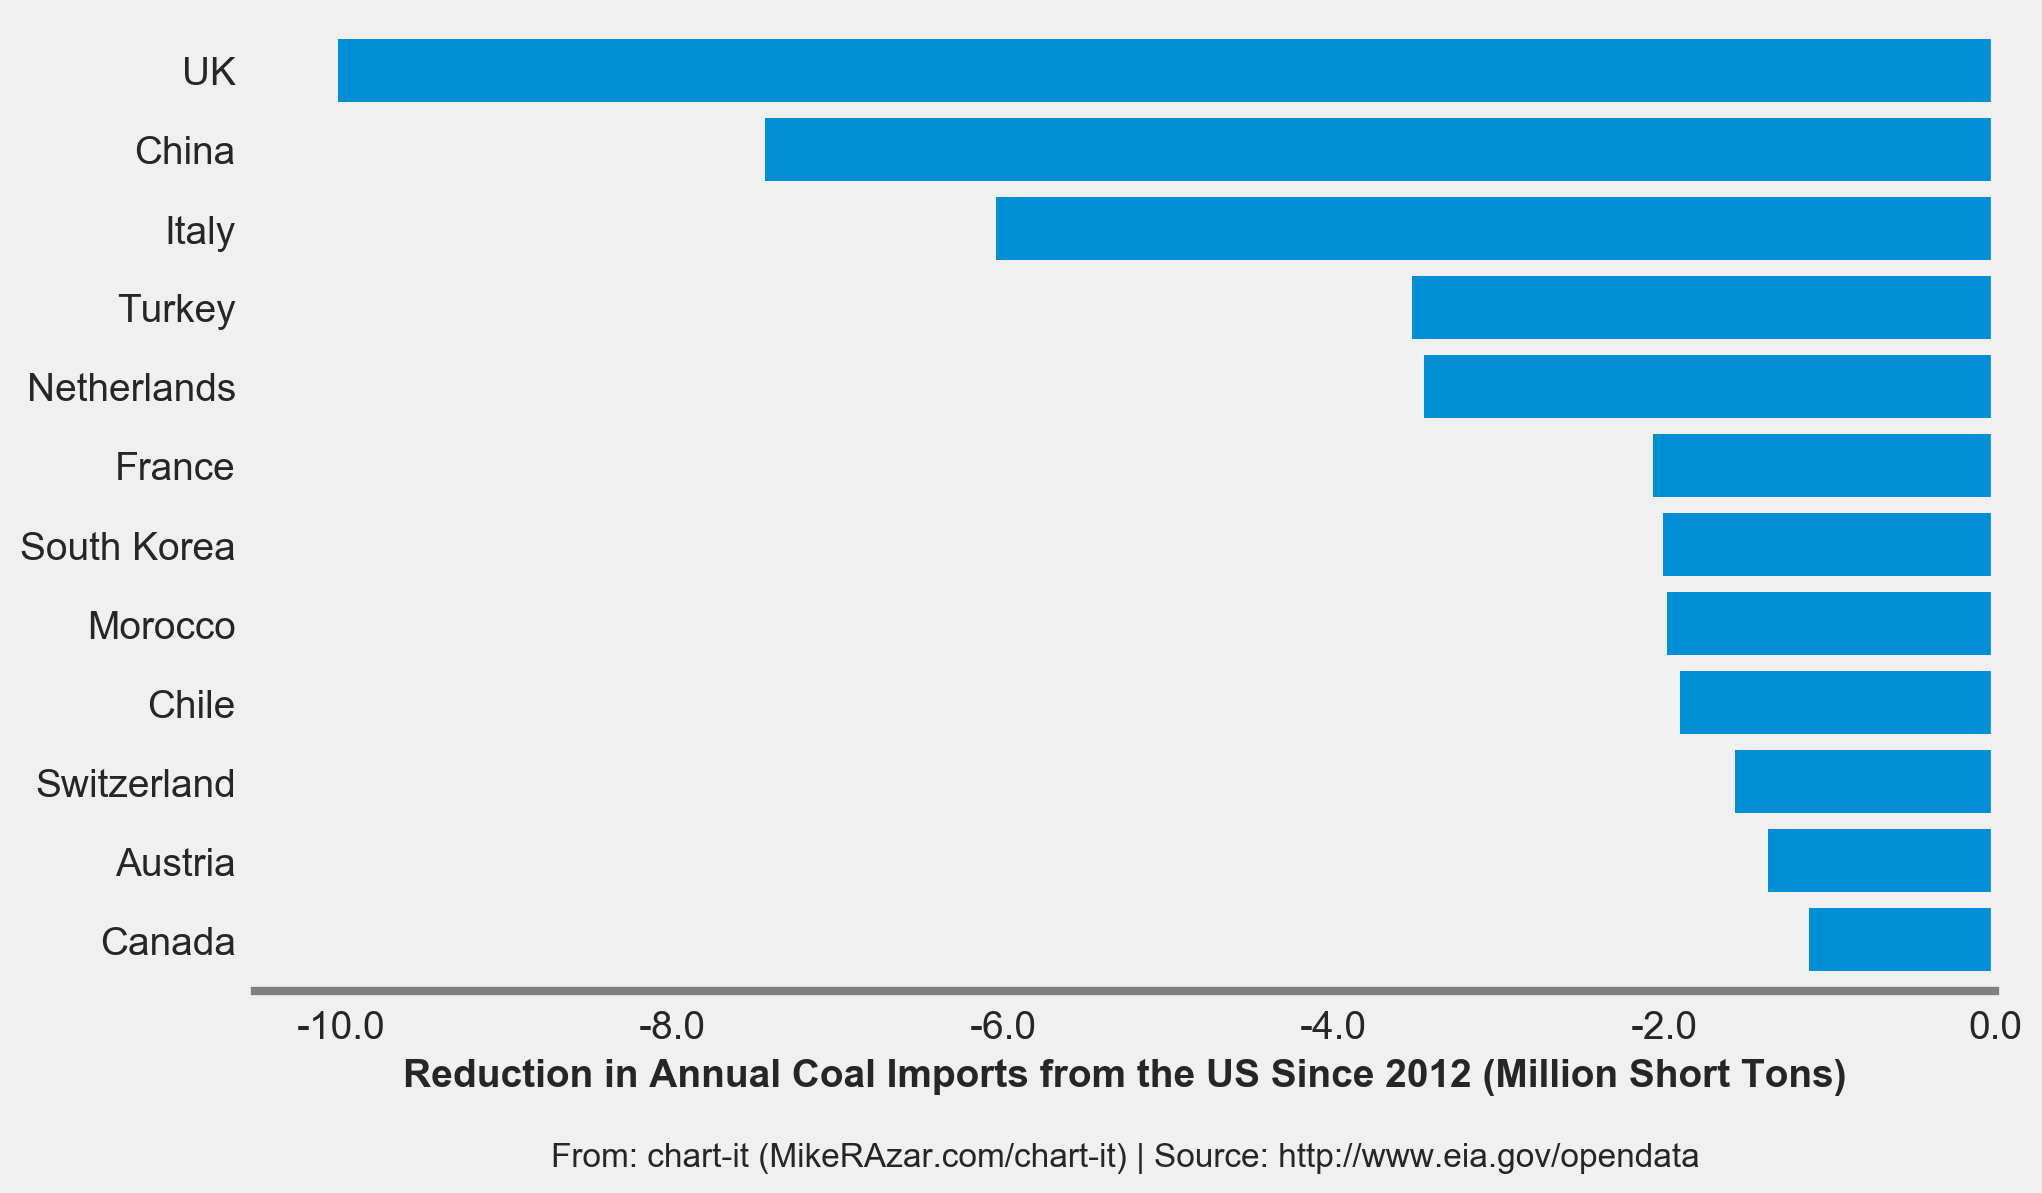
We don’t want to defame countries that have significantly reduced their US coal imports during the last five years because of an increase in the last year. Figure 4 shows the decrease in annual US coal imports from countries that reduced their imports the most since 2012 (when US coal exports peaked). There is some overlap in the countries in Figure 3 and Figure 4. While the UK, China, Turkey, France, South Korea, and Morocco have imported more coal so far in 2017 (on a trailing 12-month basis) compared to 2016, their imports are still lower than they were in 2012.
The same cannot be said of Japan and India, which have not meaningfully reduced their demand for US coal.
Figure 4. Decrease in Annual Coal Imports from the US Since 2012 (Million Short Tons)
So how have South Korea, Japan, and China helped American coal miners? According to the US Department of Labor’s Bureau of Labor Statistics, there were 50,500 coal mining jobs in December 2017, up from a low of 48,600 jobs in September 2016. This is likely due to the increase in coal exports and also the increase in US coal consumption at the end of 2016 (Thanks, Obama), but gains in US consumption mostly disappeared by September 2017. There were actually more coal jobs in September 2017 (51,700) than there were in December 2017 (50,500). This suggests that coal miners have actually lost jobs under the Trump administration’s policies and that job gains since 2016 are thanks to our trade rivals.
Trump routinely attacks “unfair” Chinese, Japanese, and South Korean trade practices that he alleges harm US industries, but his coal miner base would do well to remember that the reprieve they’ve so far experienced in 2017 is the result of these same countries’ trade practices. US coal consumption (mostly in the power sector) continues to decline despite Trump’s campaign promises to support US coal.
So why hasn’t US coal consumption increased in 2017? Coal is consumed mainly for power generation in the US. Coal’s share of US power generation has continued to fall relative to other fuel sources, including natural gas, wind, solar, and even hydro.
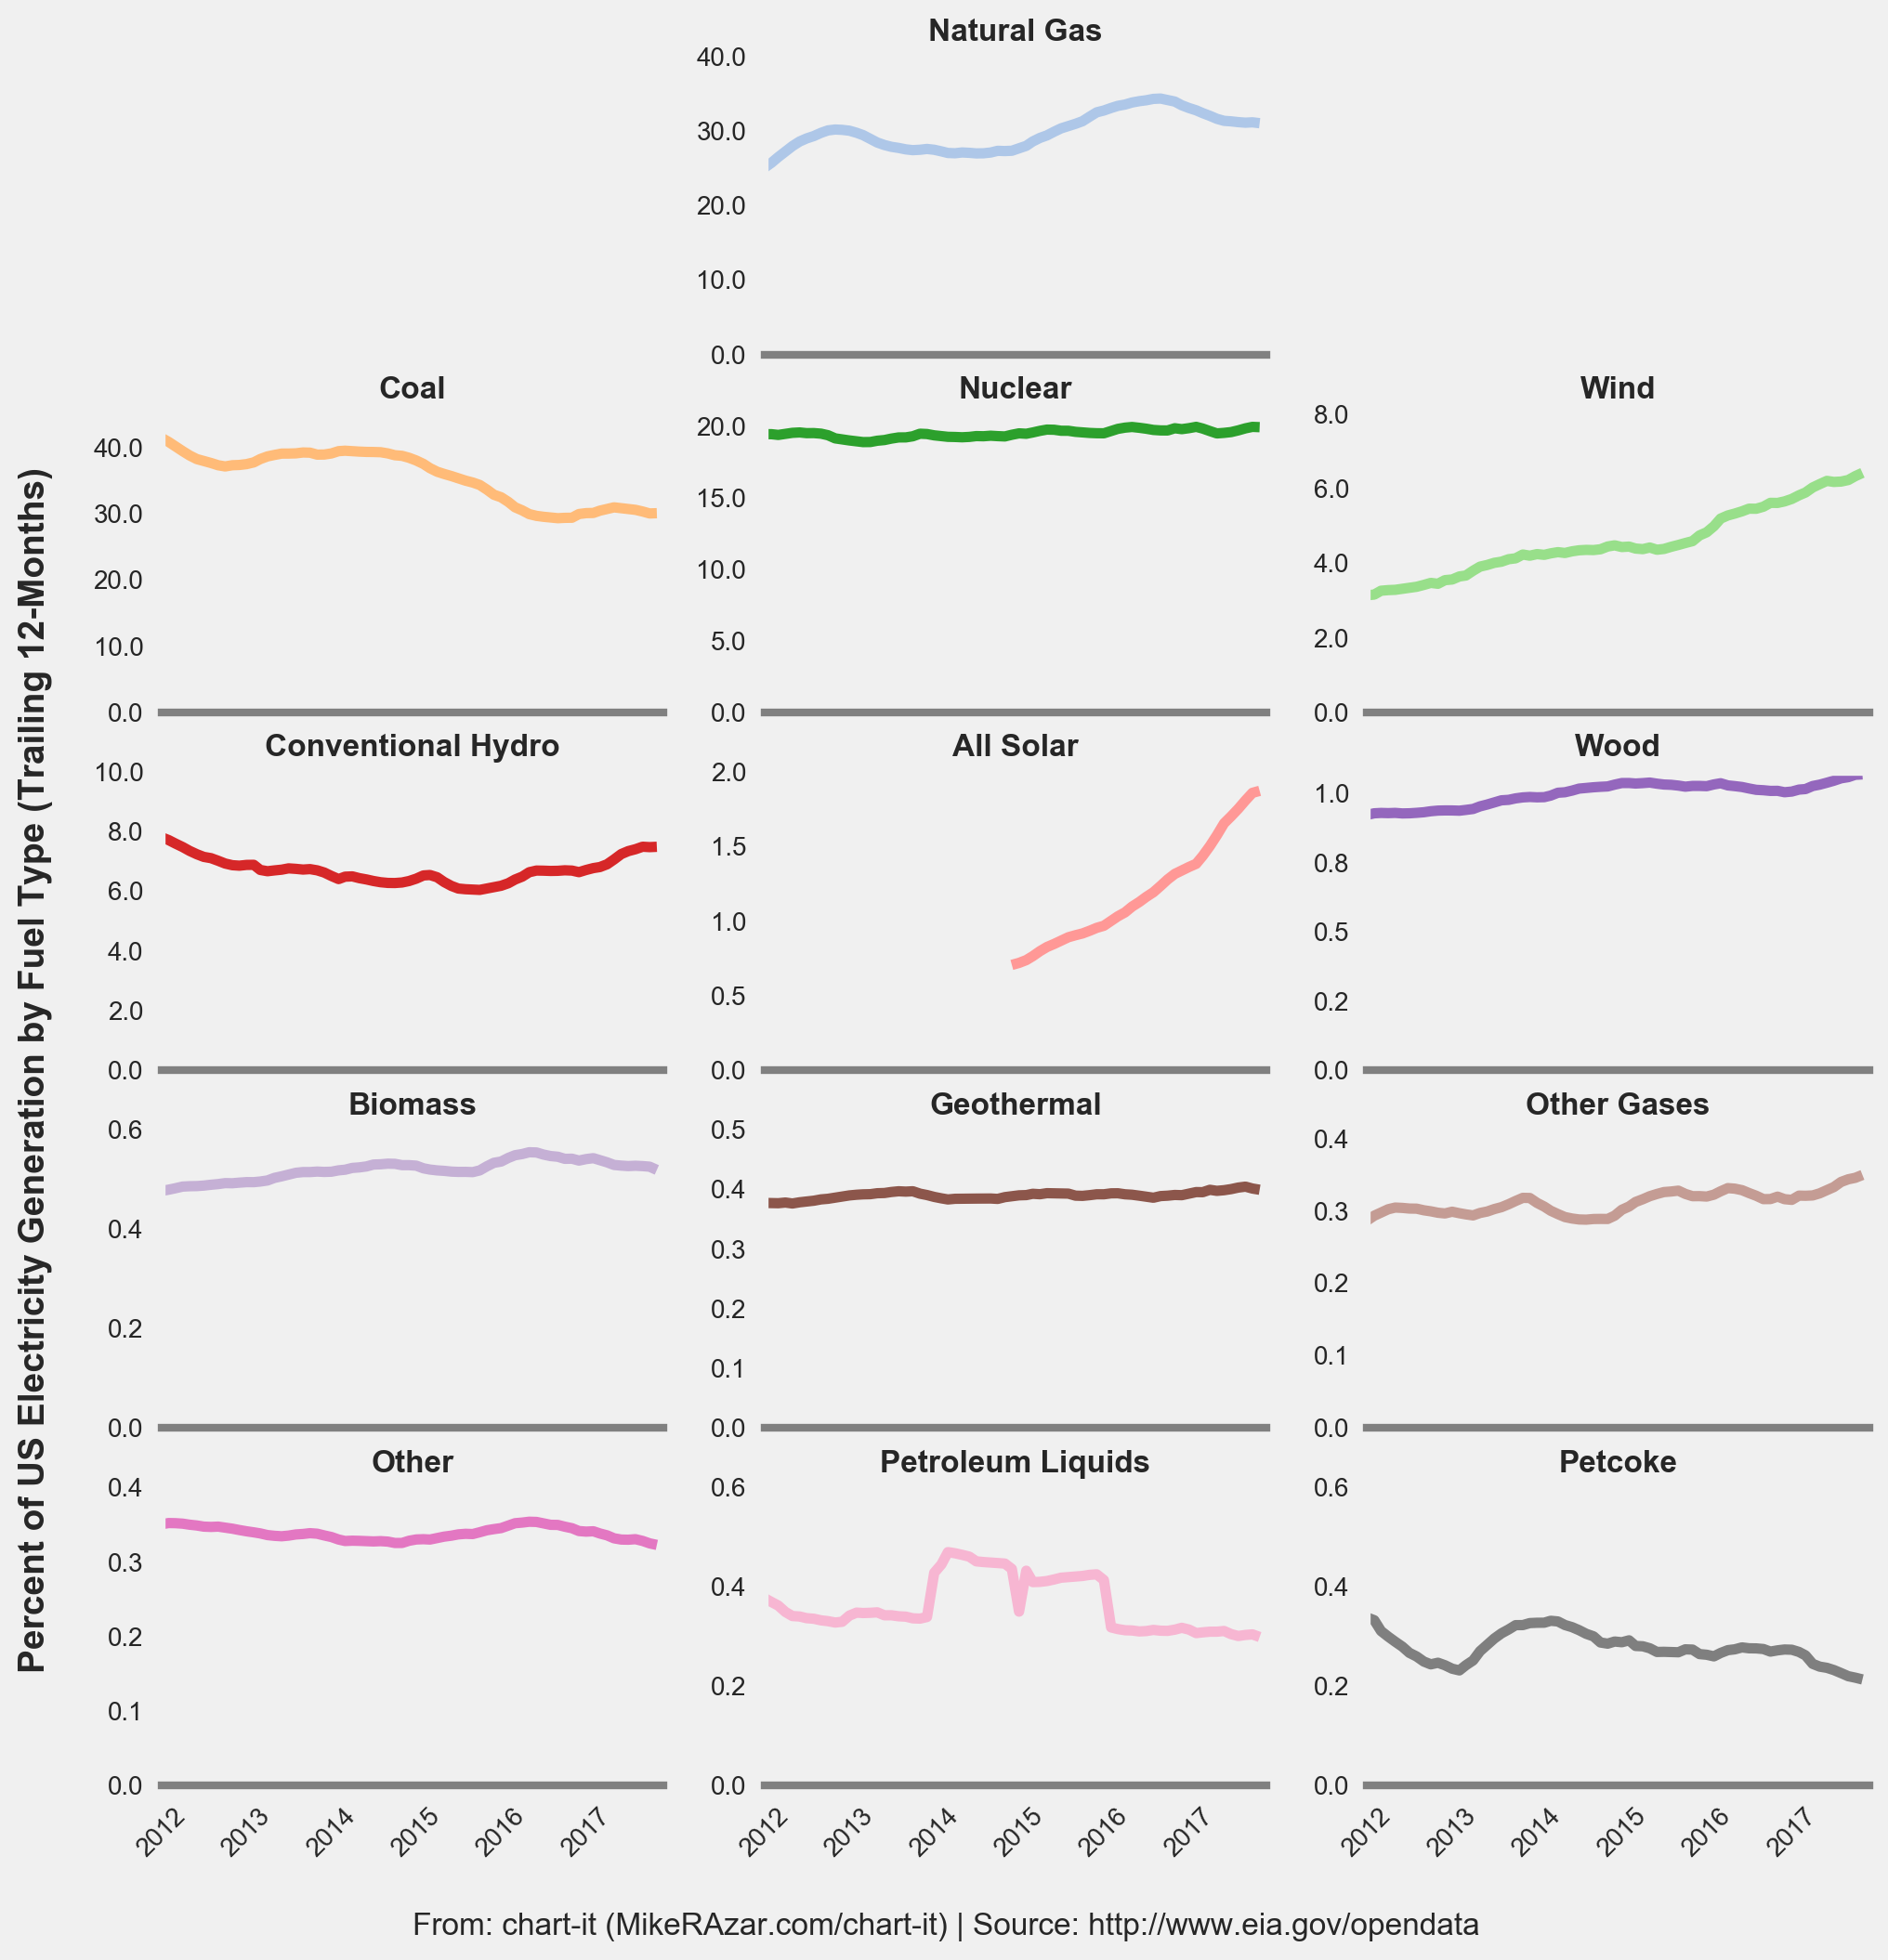
Figure 5 shows the percent of US electricity generated by fuel type since 2012. Coal’s share fell from about 40% in 2012 to 30% today. Notably, coal’s share increased to 33-34% during Obama’s final two months in office. Since Trump’s inauguration, coal’s share has fallen back down to 30%. Even during Obama’s last full year in office, coal’s share was 29.9% compared to 29.7% in 2017. Trump’s policies have so far not helped to increase US coal consumption. Coal miners owe more to our trade rivals.
Figure 5. Percent of US Electricity Generation by Fuel Type (Trailing 12-Months)
This analysis was performed using information from the Energy Information Administration’s (EIA) application programming interface (API), which allows developers to more easily access their vast statistical database. The EIA API database can be found here. The source code for the analysis can be found here. Also, you can find chart-it’s very own Python wrapper around the EIA API here.