Ever wonder how the performance of the NBA’s best players has changed over time? In this post, we’ll explore the performance of stat leaders in every NBA season since 1950.
This analysis uses a dataset of NBA player statistics between 1950 and 2017 from Kaggle. The dataset contains about 25,000 data points, each corresponding to a player’s performance during a given season.
Let’s examine six key stats: points per game, blocks per game, steals per game, assists per game, total rebounds per game, and three-point field goals per game.
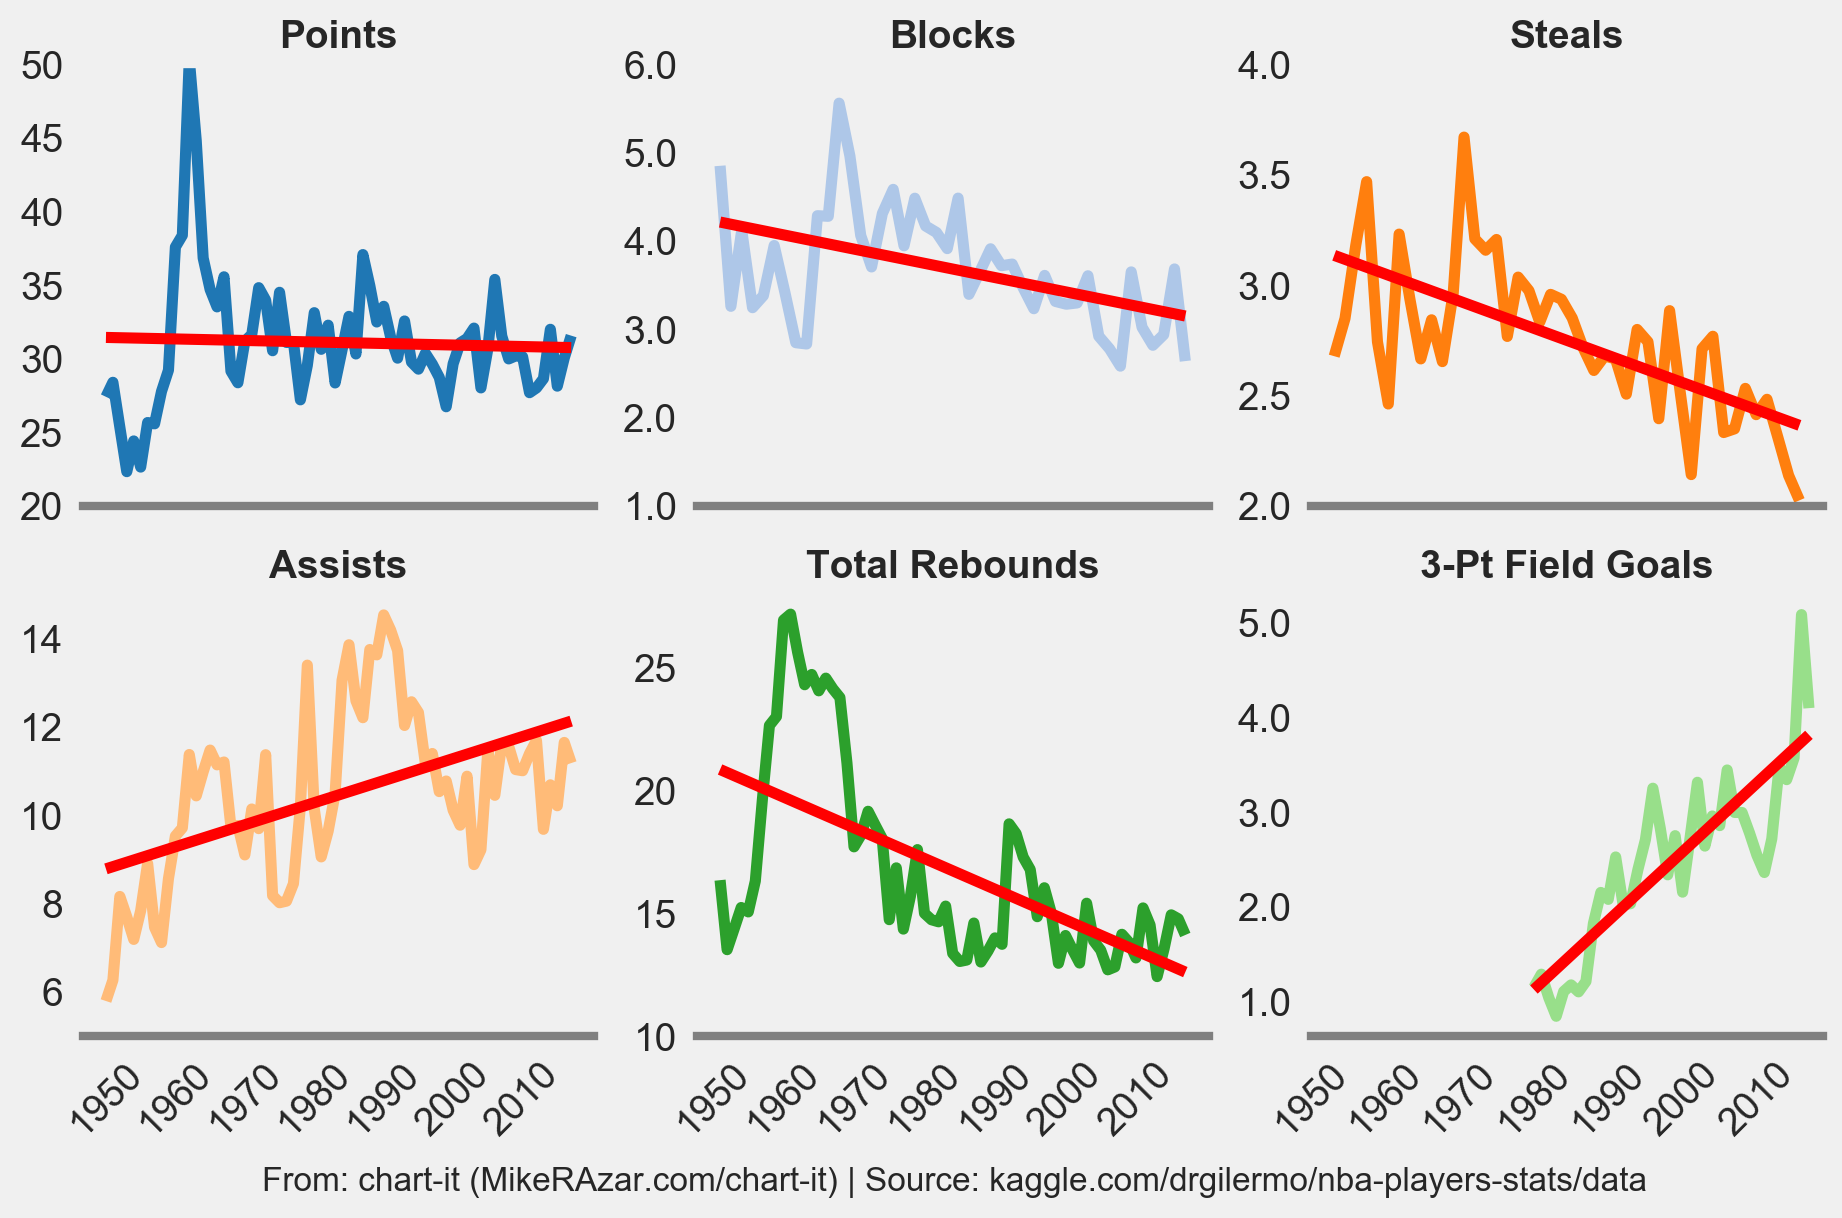
Figure 1 shows the performance of the stat leader in a given season. There is a bit of variability in the performance of stat leaders from season to season but we can observe some trends. (Trivia: Who was scoring 50 points per game in the 1962 season?). Let’s try to smooth out the data to see if we can identify a long-term trend in stat leader performance.
Figure 1. Stat Leader Performance by Season (Average Per Game)
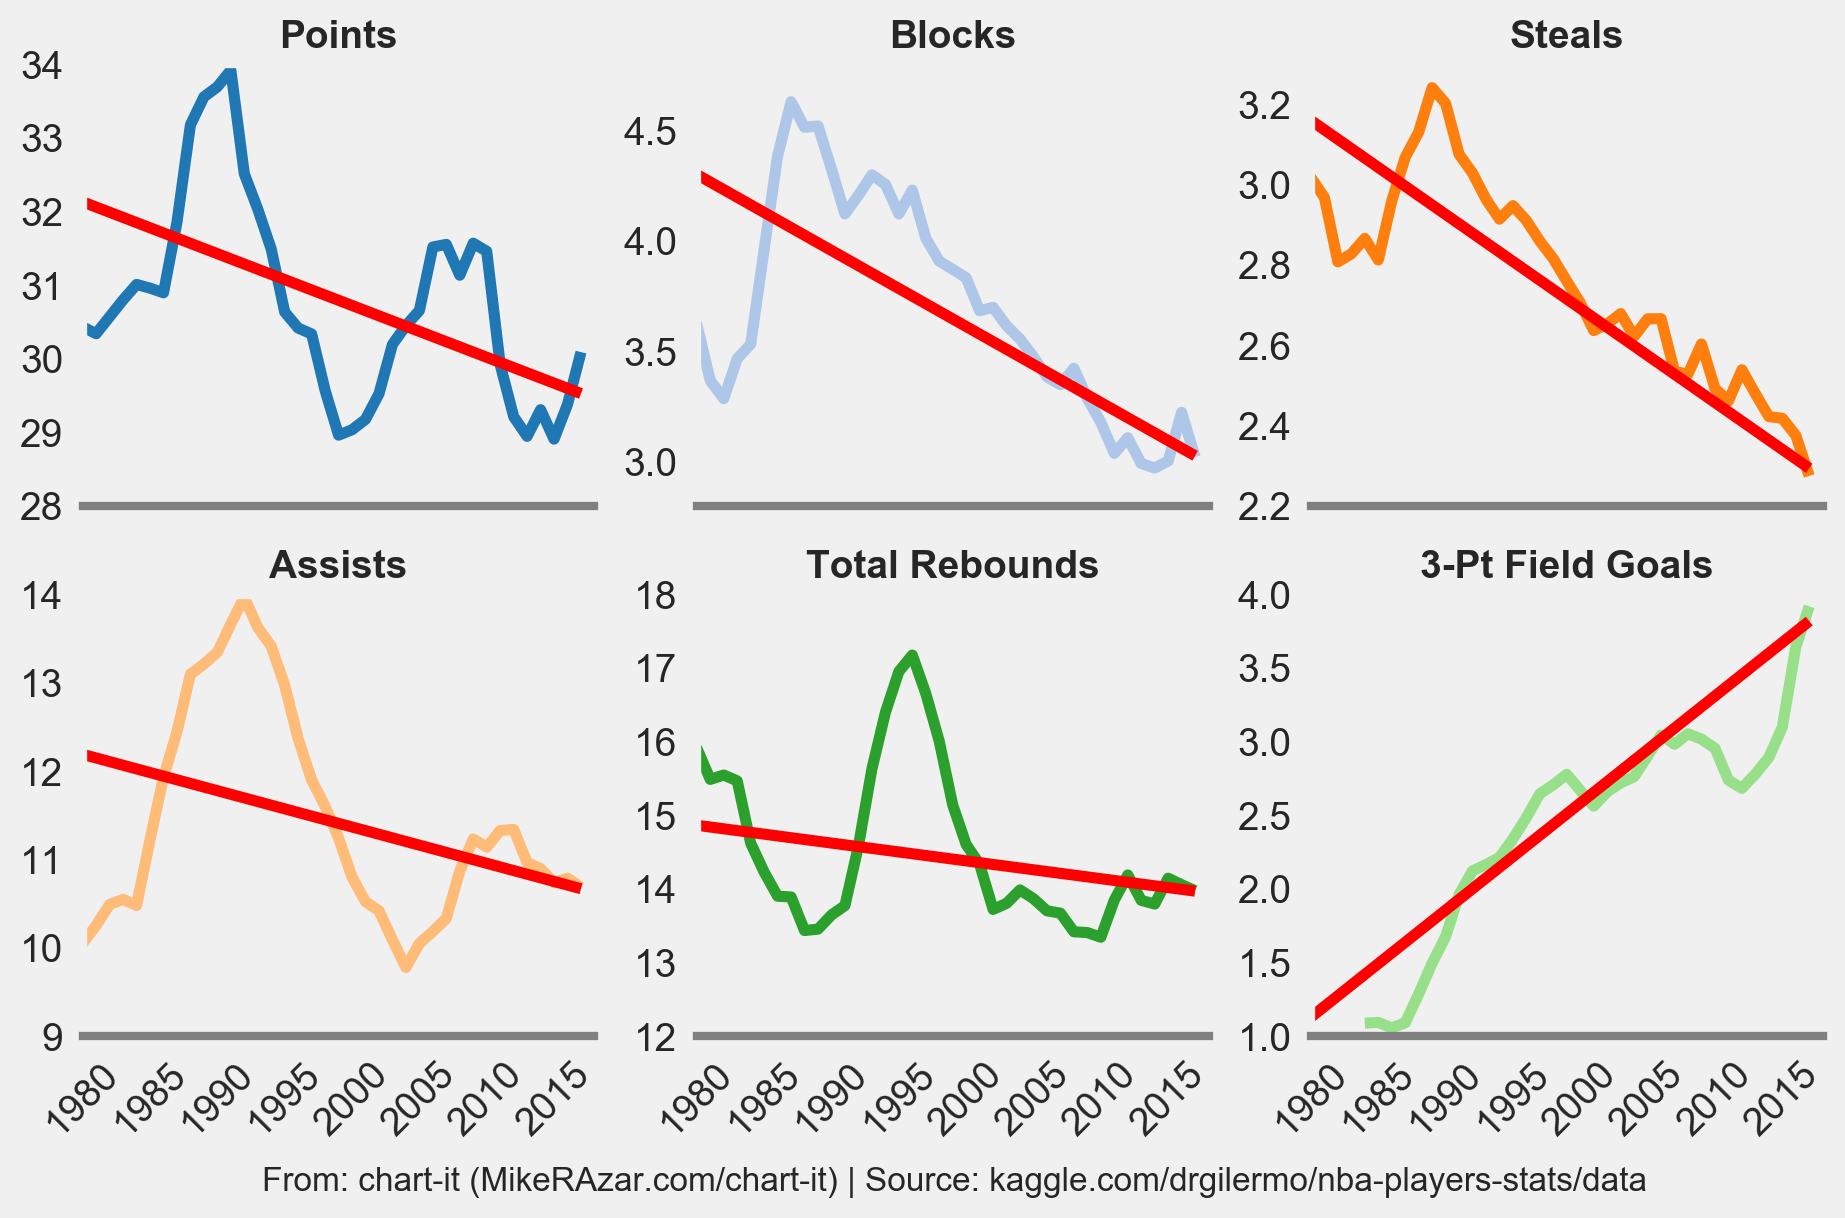
One way to smooth out the data is to convert it into a rolling average. Also, the NBA has changed over time and certain structural changes to the game make it difficult to compare the distant past to the modern era. So let’s also focus on the period after 1979, when the NBA adopted the three-point field goal. Figure 2 shows the same stats from Figure 1 but on a rolling five-year average basis from 1980.
There is a clear (albeit slow) decline in the performance of stat leaders over this period, except for three-point shooters.
This trend could make sense in the context of an NBA league that has grown significantly since the 1950’s, attracted more talent, and developed more sophisticated offensive and defensive team strategies. It would seem reasonable to expect that stat leaders would score fewer points (but get better at shooting three-pointers), get fewer assists, gather fewer rebounds, block fewer shots, and make fewer steals when these plays are shared between a larger group of talented players.
There have also been a host of major rule changes since the 1980’s that have affected offensive and defensive strategies. For example, rules related to: the defensive three-second violation, hand-checking, the length of the three-point line, and others. These rules have had a dramatic effect on the way the game is played. This analysis is not meant to identify how specific rule change have affected stat leader performance, and they certainly have, but simply to observe and comment on long-term trends in such performance.
Figure 2. 5-yr Rolling Average of Stat Leader Performance by Season (Average Per Game)
If our theory that an increase in the talent pool and use of more sophisticated team-based strategies has affected stat leader performance, then we would expect to see more parity between the performance of the stat leader and the next best performers (95th percentile level, for example). This would indicate an increase in the number of elite players. In general, it would be difficult to consistently score 40 points per game if the league is filled with extremely talented players.
Figure 3 shows the percent by which the stat leader’s performance exceeded the 95th percentile performance level in a given season. The pattern is all over the place. There appears to be a bit of a tightening for some of the stats (blocks, steals) but increase/slight increase for others (points, assists, total rebounds, three-point field goals). This doesn’t tell us the full story of the slow and steady decline of NBA stat leaders.
An increase in player talent may account for some of the long-term trend but there could be other factors as well. Another possibility, for example, is that the stats leaders are just playing fewer minutes per game and, therefore, have less time to make plays. Let’s take a look at the point leaders’ average minutes played per game.
Figure 3. Rolling 5-yr Average Stat Leader Performance Above 95th Percentile Performance Level (Percent)
Let’s focus on the point leaders. Figure 4 shows the average minutes per game by each season’s point leader. The data show that point leaders played slightly more minutes per game between 1980 and 1995, although points per game declined during this period (it seems players were not being as productive in the minutes that they were playing – we’ll examine productivity per minute played in the next section).
Starting in the mid-1990’s, there was a surge in minutes played and this resulted in a bounce in points per game but, as we’ll see in the next section, “per minute” productivity fell to its lowest level.
Interestingly, minutes played began to fall sharply from around 2008 (partly a result of the 2005 Collective Bargaining Agreement) and is now the lowest it’s been in at least 38 years despite a rebound in points per game. This suggests that “per minute” productivity has been improving for point leaders. Let’s take a look at how stat leader productivity on a “per minute” basis has changed over time.
Figure 4. Rolling 5-yr Average Point Leader Minutes Per Game
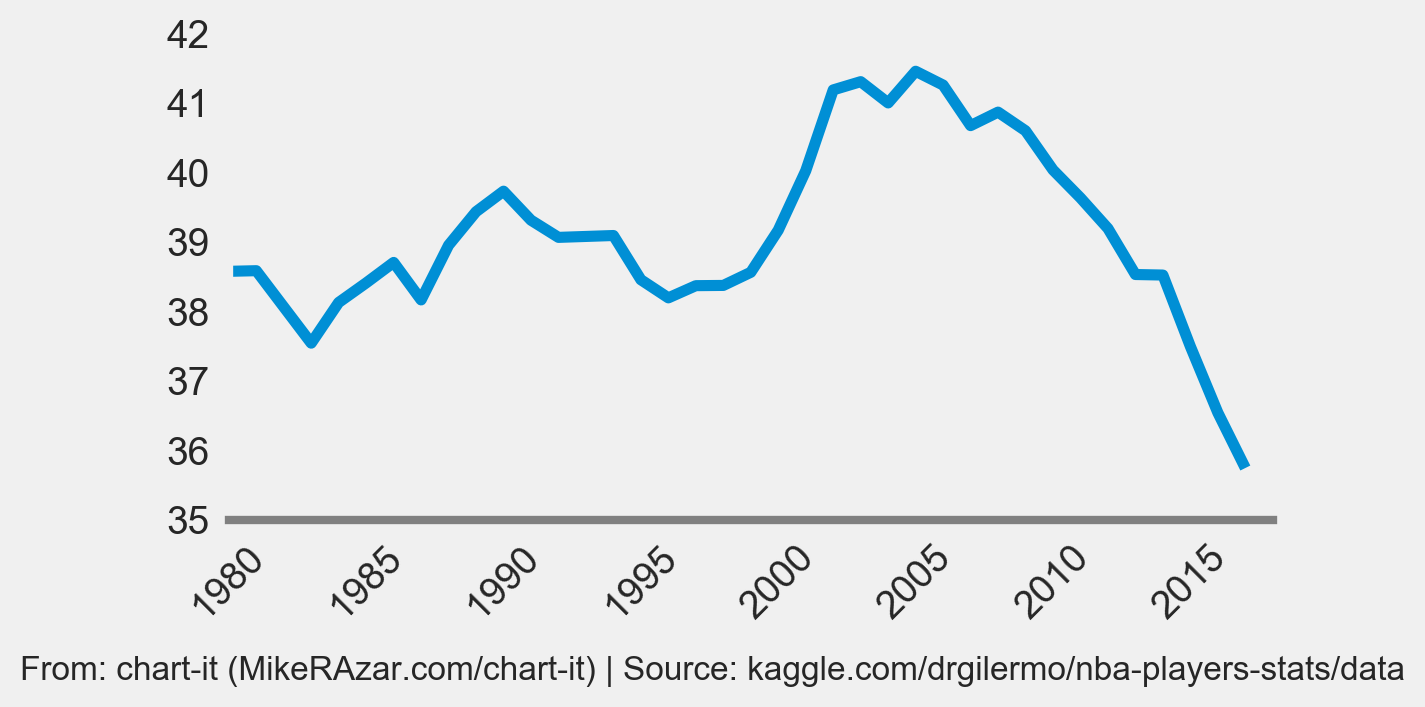
Figure 5 shows the stat leaders’ productivity per minute played. The long-term trend is much clearer on a per minute basis. Stat leaders are becoming less productive over time (except for three-point shooters).
Some interesting observations jump out. Between 1980 and 1995, point leaders were scoring fewer and fewer points despite playing slightly more minutes as point productivity per minute was in decline. Starting in the mid-1990’s, point leaders began playing significantly more minutes per game and, although this resulted in more points scored per game, point per minute productivity fell to a record low.
Something changed in 2013. Point leaders were playing fewer and fewer minutes while scoring more points per game as point productivity per minute surged. This is about as productive as point leaders have been since the 1980’s. What is causing this pattern and does this represent a reversal of the long-term decline? Let’s take a closer look at the performance of point leaders.
Figure 5. Rolling 5-yr Average Stat Leader Performance Per Minute Played

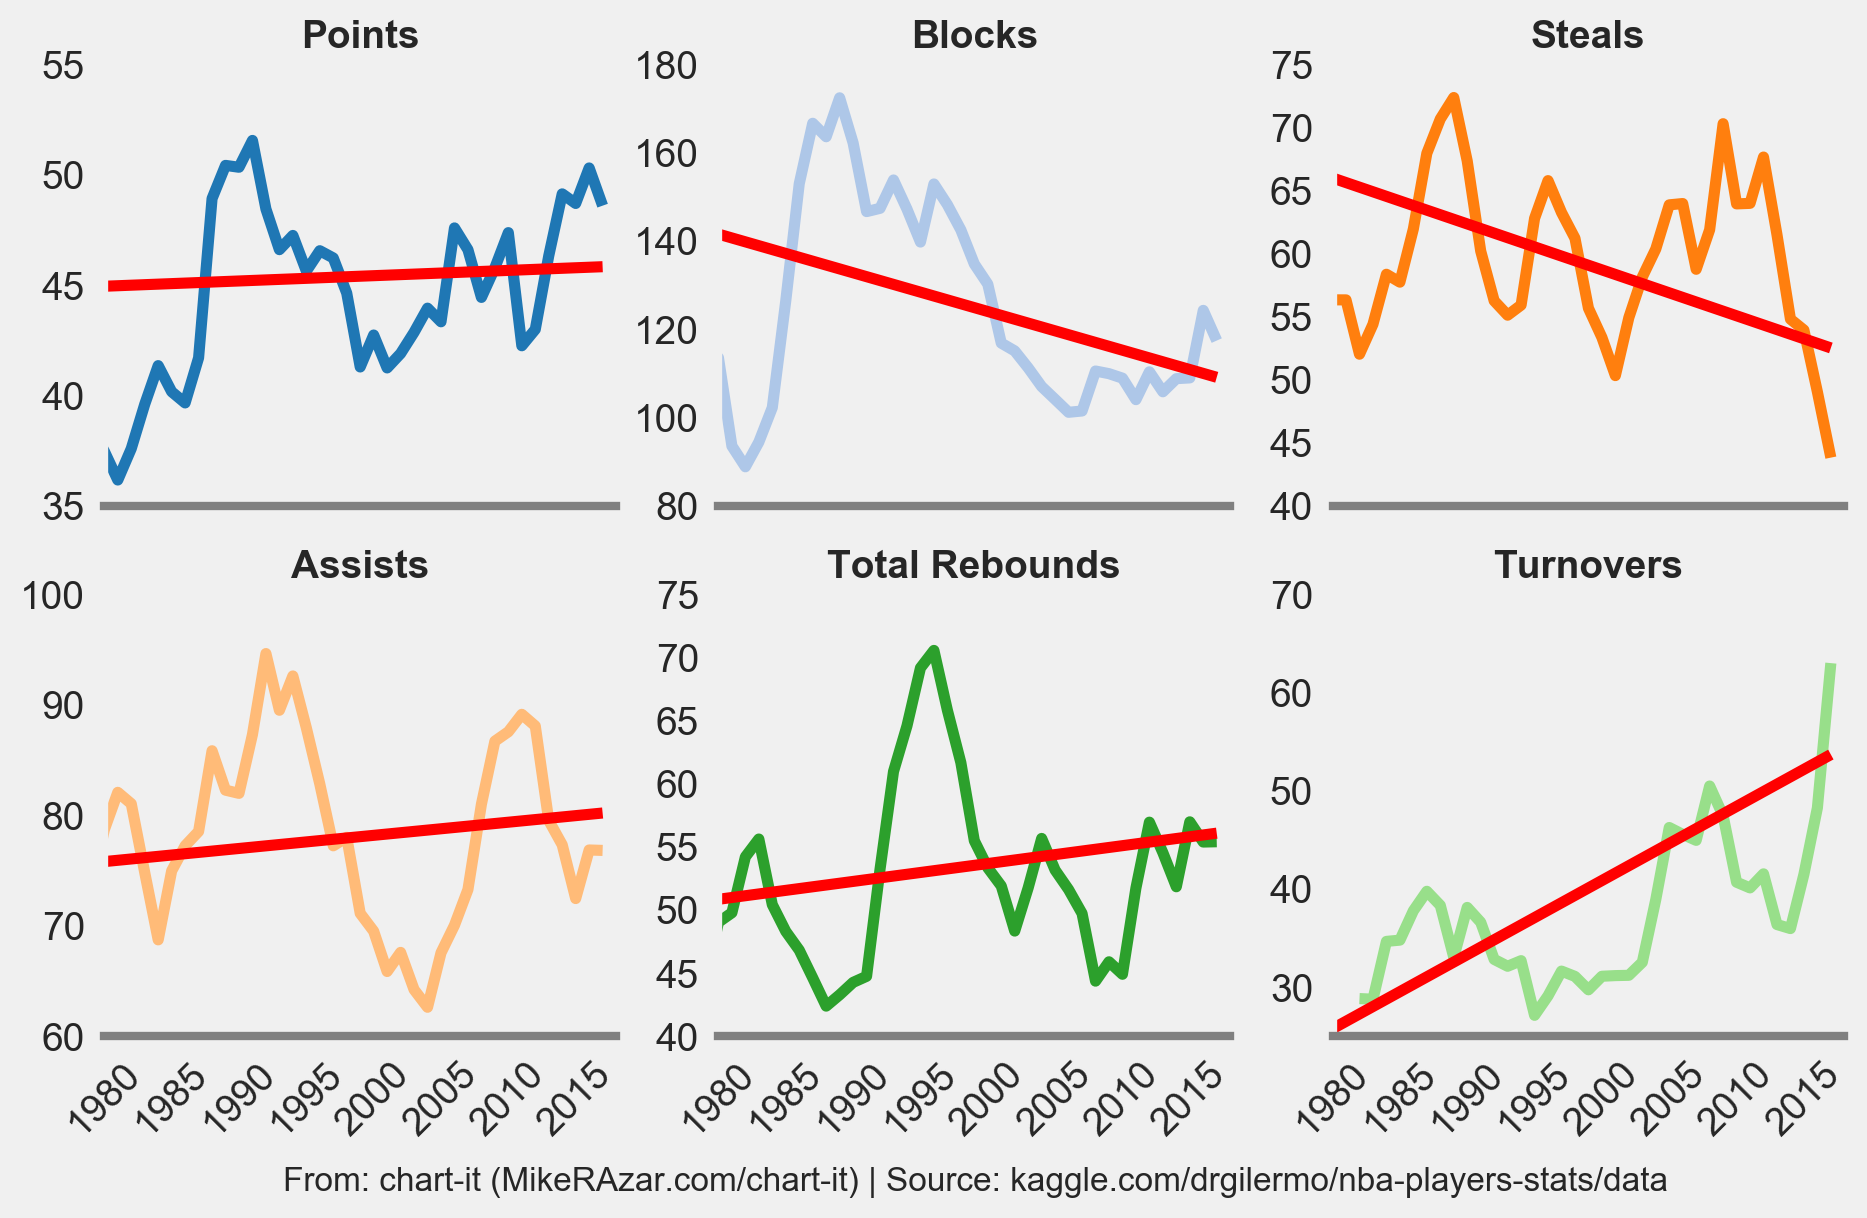
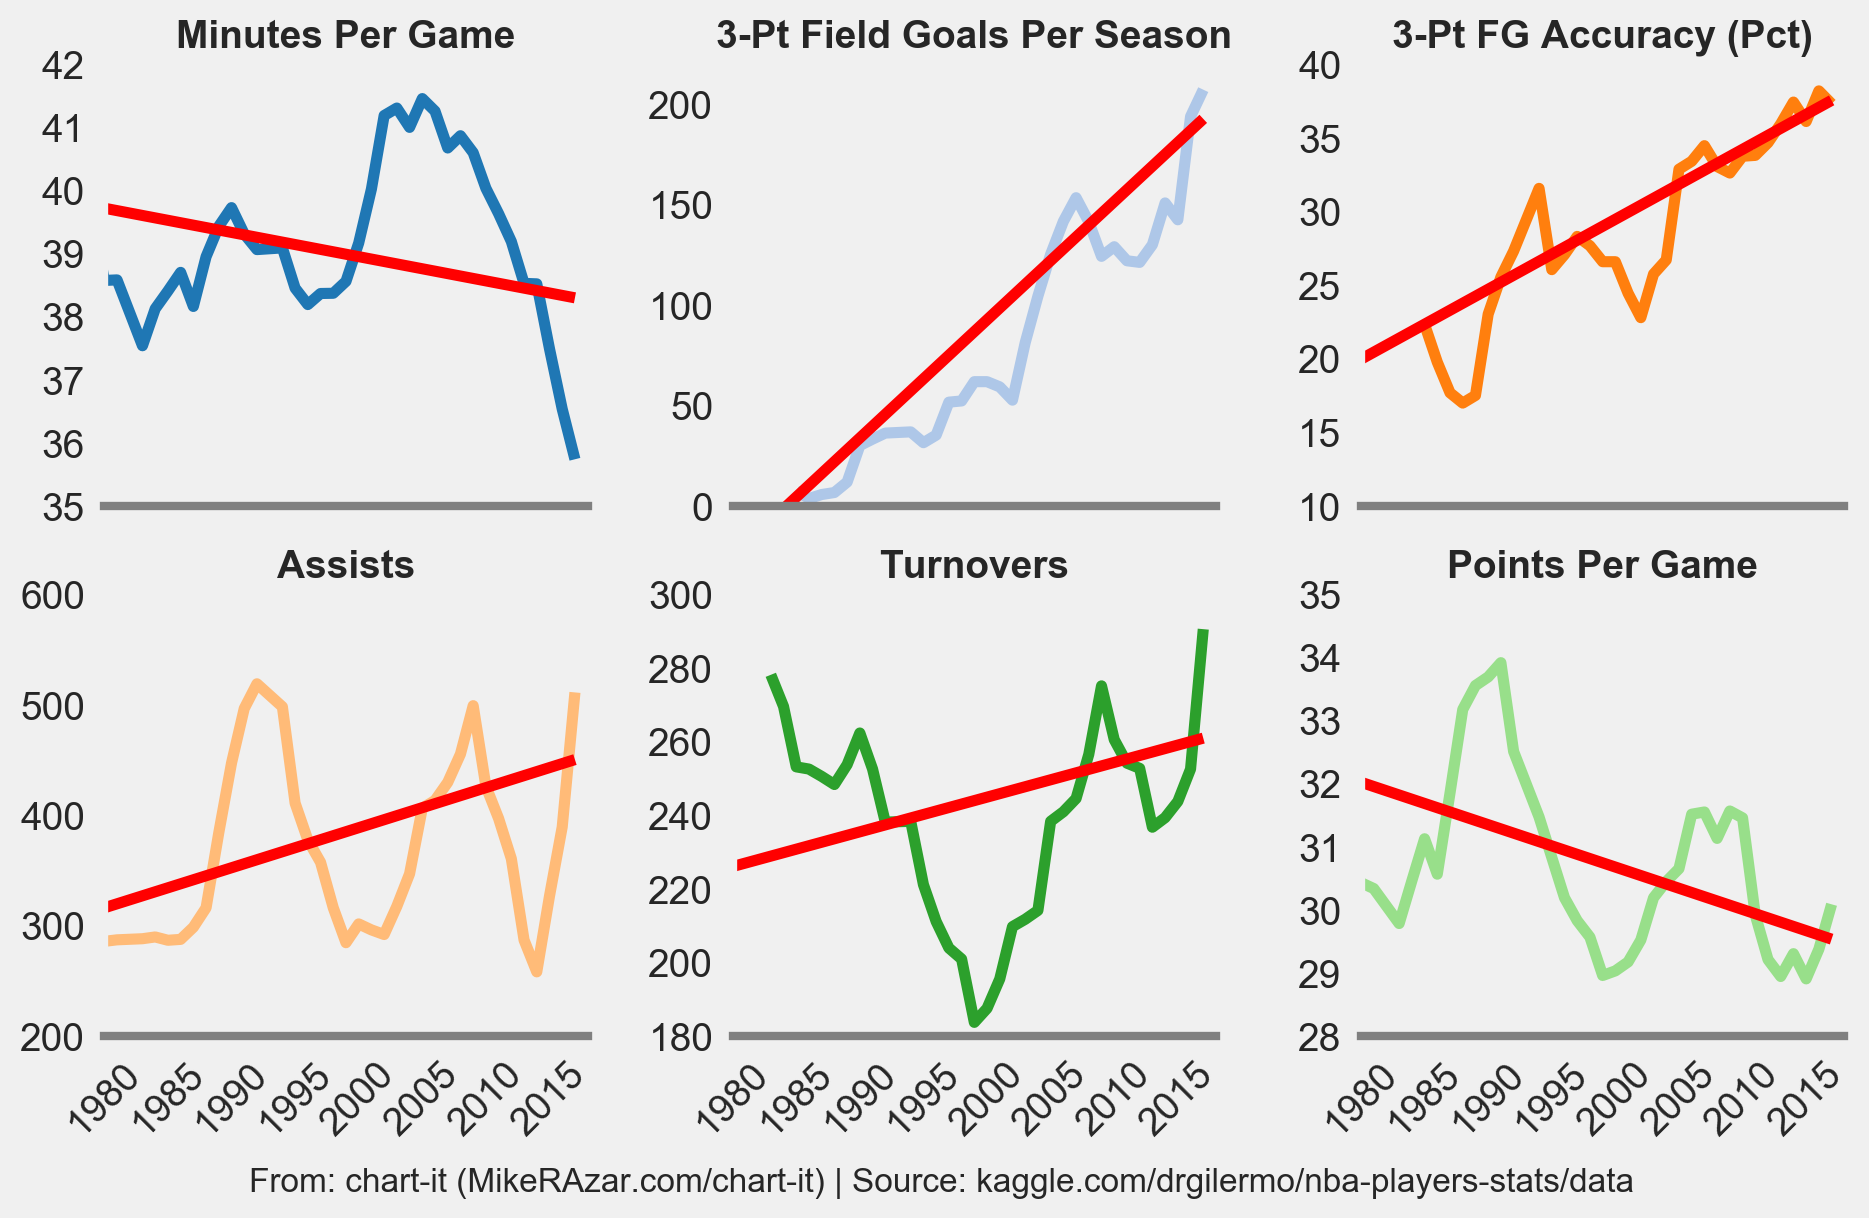
Figure 6 provides key statistics for each season’s point leader. These might help us to understand the recent patterns that we observed previously.
Since the early 2010’s, point leaders have been playing fewer and fewer minutes per game, reaching a 38+ year low during the 2017 season. At the same time, they’re scoring significantly more three-pointers and with greater accuracy. The net result is that, despite playing fewer minutes, point leaders are scoring more points.
Turnovers and assists by point leaders are also surging, highlighting the growing importance of point leaders to their teams’ offensive strategies (i.e., the more you handle the ball, the more turnovers and assists you’ll have) and the growing popularity of team-based offensive strategies, like the pick and roll.
While the long-term trend is still downward, the increase in three-point field goals and improved shooting accuracy has allowed point leaders to play fewer minutes and potentially arrest the long-term decline that has affected the other stat leaders. “Points Per Game” has rebounded since 2013, but it’s too early to tell if this represents a genuine reversal of the long-term trend. Worth noting is that, if point leaders were still playing 41 minutes per game today, as they were in the early 2000’s, they would potentially add another 3-4 points per game to their season average, which would be near a new record for the 1980-2017 period.
Figure 6. Rolling 5-yr Average of Key Stats for Point Leaders
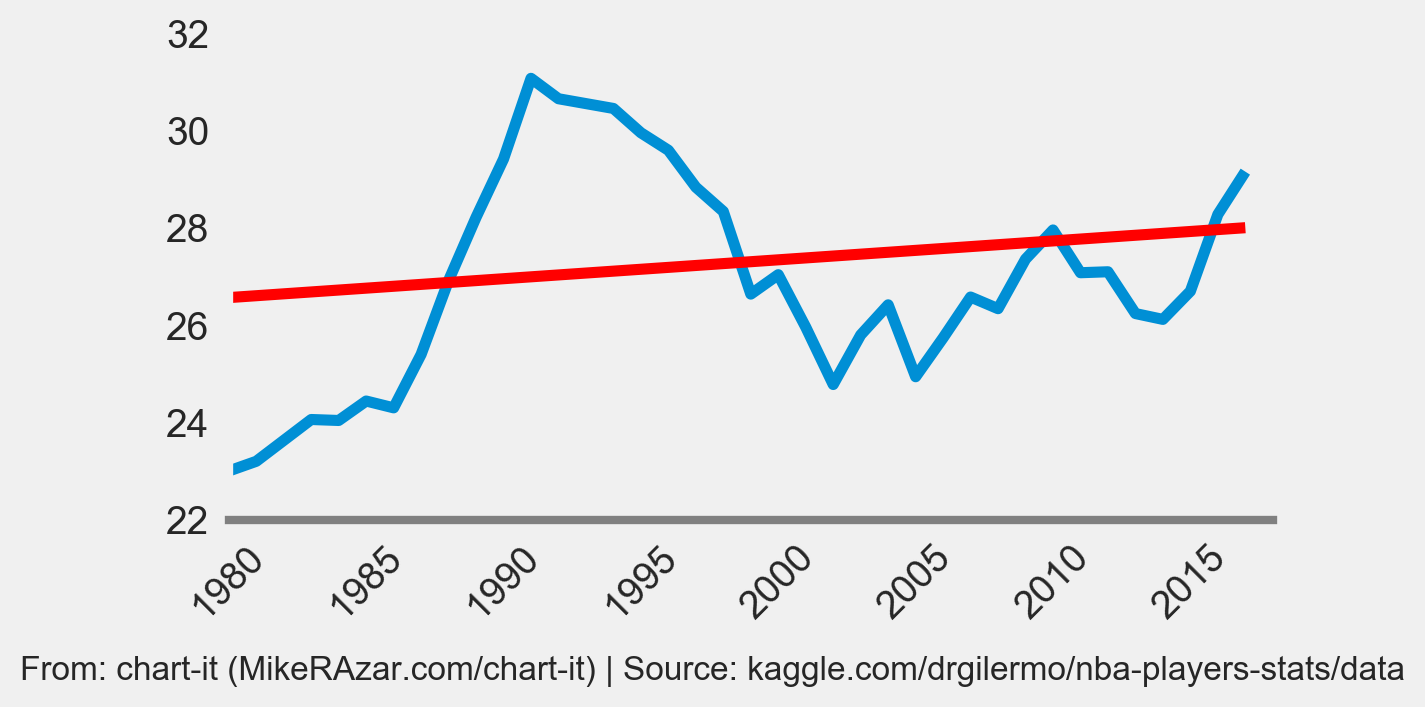
Overall, the PER (an aggregate measure of a player’s performance) of point leaders appears to have turned around after a multi-decade decline, as a result of changing play patterns, which include more three-point shooting. It may only be a matter of time before a point leader consistently achieves the 31-32 PER achieved by Michael Jordan between 1988 and 1991. The three-pointer and rule changes may have saved the point leader.
In future posts, we’ll examine how player performance has changed for the average NBA player and for the top percentiles (rather than just the stat leaders).
Figure 7. Rolling 5-yr Average PER of Point Leaders
______
The source code for the analysis can be found here.