Earlier this week, we examined the surge in D.C.’s crime rate in 2015. We discovered that, as of August 2015, D.C.’s monthly homicide rate had more than doubled from the 2011 to 2014 average. Since 2011, there had been only one month when D.C.’s murder rate reached as high as 16 victims. There have been 16 or more murders in every month since May of this year (including 14 so far in August).
In this write-up, we’ll examine the violent crime rate within Wards and neighborhood clusters, and rank the most improved and most regressed neighborhoods. The data shows that just three neighborhoods account for nearly 80 percent of the increase in the murder rate so far this year.
D.C.’s crime incidents data can be found here. The source code for the data analysis can be found here. The murder of 23-year old Matthew Castrol Shlonsky on August 16, 2015 in the Shaw neighborhood of Northwest D.C. did not appear to be reported in the crime incidents data. We have manually added it.
Homicides by Ward
Let’s take a look at the annual homicide rate by Ward (Figure 1). For those of you less familiar with D.C.’s geography, here’s a boundary map of each Ward. Since we’re only halfway through 2015, the charts below only consider crimes reported between January and August 19 of each calendar year (rather than the entire calendar year). We’ve excluded Ward 3 because there are not enough data points in that area to create a meaningful chart (although the murder rate there has increased between 2014 and 2015).
Murders are up in every Ward, except 1 and 7, with Ward 8 registering the largest increase. While D.C.’s homicide rate has clearly increased between 2014 and 2015, the rate appears to have begun its increase in 2013 and not 2014. Only Ward 7 experienced a significant decrease in homicides between 2014 and 2015.
Figure 1. Homicides by Ward
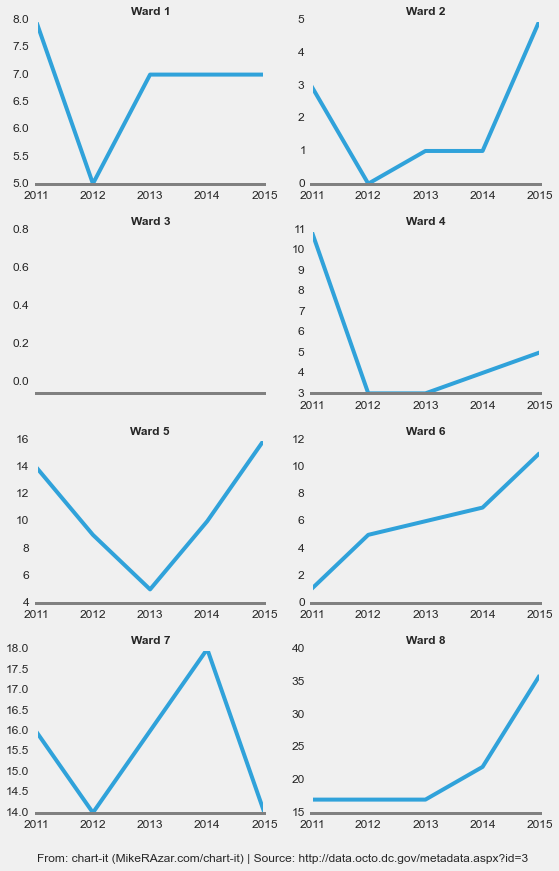
The increase in the homicide rate in Ward 8 is equal to just under half of the net increase in the number of murders between 2014 and 2015. The increases in Wards 3 and 5 each make up about 18 percent. Within each Ward, specific neighborhoods have been affected more than others.
Using D.C.’s neighborhood cluster classification, we can calculate the change in the murder rate on a neighborhood by neighborhood basis. The largest increase in murders between 2014 and 2015 occurred in Woodland/Fort Stanton, Garfield Heights, Knox Hill (Ward 8, +8 murders), Douglass, Shipley Terrace (Ward 8, +8 murders), and Shaw, Logan Circle (Ward 2, +5 murders). These three neighborhoods account for 80 percent of the increase in the murder rate so far this year.
The most improved neighborhoods are Sheridan, Barry Farm, Buena Vista (Ward 8, -6 murders) and Deanwood, Burrville, Grant Park, Lincoln Heights, Fairmont Heights (Ward 7, -4 murders).
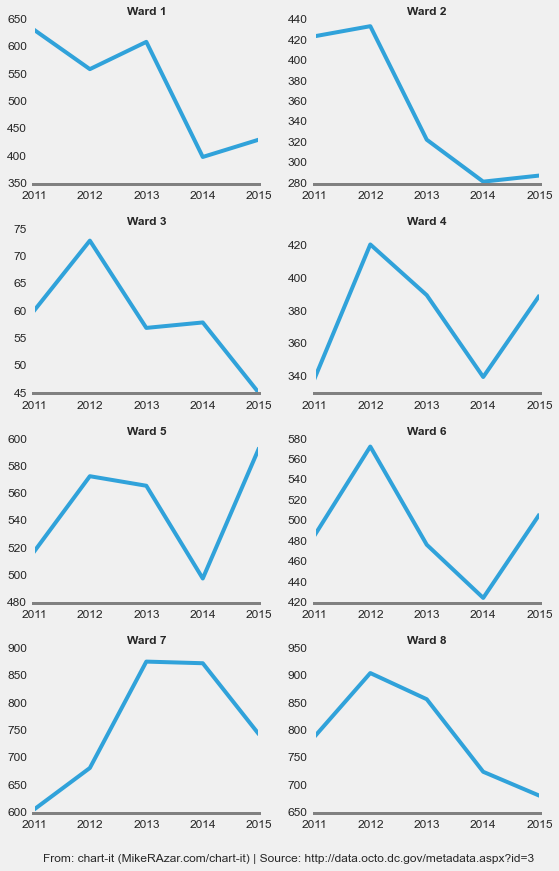
Non-Homicide Violent Crimes by Ward
Figure 2. Other Violent Crimes by Ward
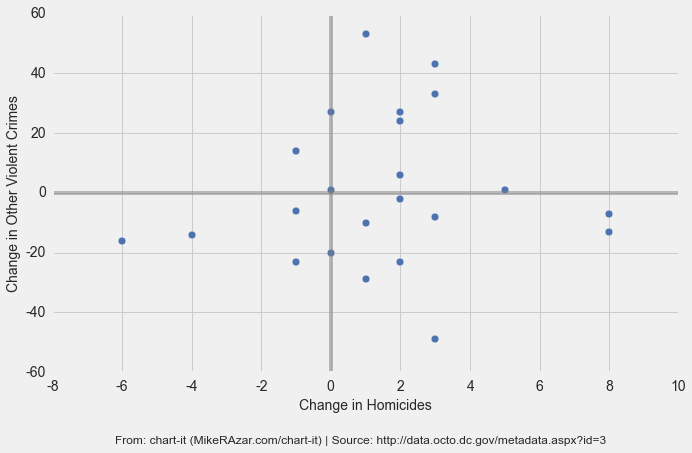
Relationship between Homicide and Other Violent Crimes
Figure 3. Relationship Between Change in Homicides and Other Violent Crimes
Most Improved and Most Regressed Neighborhoods
As we noted above, Ward 7 has seen the most improvement among all of the wards, registering significant drops in both homicides and other violent crimes between 2014 and 2015. Chart-it has also ranked D.C. neighborhoods by the largest increase and decrease in violent crimes between 2014 and 2015. We excluded the bottom 20th percentile to prevent neighborhoods with a very low crime rate from distorting the ranking.
Figure 4 shows the top ten most regressed neighborhoods. The top ranked neighborhood is in Ward 4. The next two are in Wards 1 and 5, respectively.
Figure 4. Top 10 Most Regressed Neighborhoods between 2014 and 2015
| Neighborhood | Increase (pct) | Increase (#) | Avg Incidents* | |
|---|---|---|---|---|
| 1 | Lamond Riggs, Queens Chapel, Fort Totten, Pleasant Hill | 49 | 24 | 56 |
| 2 | Kalorama Heights, Adams Morgan, Lanier Heights | 49 | 23 | 84 |
| 3 | Brookland, Brentwood, Langdon | 38 | 35 | 119 |
| 4 | Takoma, Brightwood, Manor Park | 33 | 28 | 103 |
| 5 | NoMa, Union Station, Stanton Park, Kingman Park | 33 | 53 | 187 |
| 6 | Ivy City, Arboretum Trinidad, Carver Langston | 23 | 46 | 205 |
| 7 | Capitol Hill, Lincoln Park | 20 | 22 | 117 |
| 8 | Edgewood, Bloomingdale, Truxton Circle, Eckington | 19 | 27 | 157 |
| 9 | Twining, Fairlawn, Randle Highlands, Penn Branch, Fort Davis Park, Dupont Park | 18 | 21 | 134 |
| 10 | Dupont Circle, Connecticut Avenue/K Street | 15 | 11 | 111 |
* Average Annual Violent Crime incident only includes period from January to August 19 of the period 2011 to 2015.
Figure 5. Top 10 Most Improved Neighborhoods between 2014 and 2015
| Neighborhood | Decrease (pct) | Decrease (#) | Avg Incidents* | |
|---|---|---|---|---|
| 1 | Eastland Gardens, Kenilworth | -68 | -28 | 22 |
| 2 | Fairfax Village, Naylor Gardens, Hillcrest, Summit Park | -41 | -16 | 36 |
| 3 | River Terrace, Benning, Greenway, Fort Dupont | -24 | -45 | 160 |
| 4 | Sheridan, Barry Farm, Buena Vista | -21 | -22 | 115 |
| 5 | Howard University, Le Droit Park, Cardozo/Shaw | -18 | -20 | 139 |
| 6 | Southwest Employment Area, Southwest/Waterfront, Fort McNair, Buzzard Point | -17 | -9 | 60 |
| 7 | Georgetown, Burleith/Hillandale | -12 | -4 | 31 |
| 8 | West End, Foggy Bottom, GWU | -12 | -3 | 24 |
| 9 | Mayfair, Hillbrook, Mahaning Heights | -11 | -13 | 91 |
| 10 | Capitol View, Marshall Heights, Benning Heights | -8 | -24 | 186 |
* Average Annual Violent Crime incident only includes period from January to August 19 of the period 2011 to 2015.
I really aprtaciepe free, succinct, reliable data like this.
After I initially commented I appear to have clicked the -Notify me when new comments are added- checkbox and from now on every
time a comment is added I recieve four emails with the same comment.
Perhaps there is a way you can remove me from that service?
Appreciate it!
Hi, I don’t think I’m able to remove you. The service does not give me that option. I think you can remove yourself though. Try the WordPress website https://en.support.wordpress.com/comment-notification-email/