In August, we examined crime trends across D.C. neighborhoods and made a few interesting observations about the neighborhoods responsible for D.C.’s crime surge in 2015. With Halloween coming up, we wondered whether certain neighborhoods experience a seasonal spike in crime this time of year. In this post, we use D.C. crime statistics from the District’s Crime Incidents dataset from 2011 to 2014 to measure whether there is a Halloween crime bump. The source code for this analysis can be found here.Does your neighborhood have a Halloween crime spike? Look it up in Figure 2 below.
Methodology
We calculated the average weekly crime incidents for the week of October 24 to October 31 for the years 2011-2014 (Halloween Week). Then, we calculated the average weekly crime incidents from 2011-2014. We compared the average weekly crime incidents during Halloween Week to the average weekly crime incidents during the period from 2011-2014 to measure whether there is a crime bump during Halloween Week. We estimated the statistical significance of the observations using the z-test. Finally, we excluded neighborhoods with very low crime incidents to avoid distorting the results.
We saw in a previous chart-it series that the crime rate exhibits a seasonal pattern and, therefore, it may be more appropriate to compare crime incidents within clusters of months that exhibit the same seasonal pattern (or, to seasonally adjust the dataset). Using that methodology, we could exclude the low crime winter months, which would increase the average weekly crime rate and, therefore, reduce the magnitude of the Halloween crime bump. The results were not significantly different under either approach so we stuck to using the entire dataset. However, this is by no means a comprehensive study of D.C. crime trends.
Halloween Crime Spike
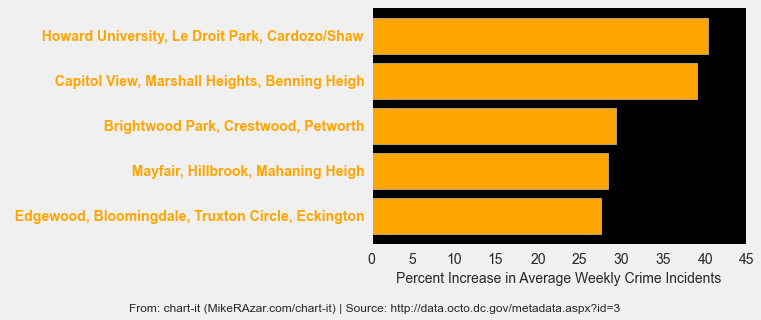
Figure 1 (yes, we had to use a Halloween color theme) shows the five D.C. neighborhoods with the highest Halloween crime bumps. ‘Howard University, Le Droit Park, Cardozo/Shaw’ has historically seen the largest increase in crime (about 40.3 percent) during Halloween. The ‘Howard University, Le Droit Park, Cardozo/Shaw’ observation is statistically significant at the < 0.03 p-value level. In other words, there is a less than 0.3 percent probability that the magnitude of the observed Halloween Week crime bump is by random chance. The statistical significance of the observations for the other neighborhoods is provided in Figure 2 below.
Interestingly, three of the top five neighborhoods were also in chart-it’s list of top 10 most improved D.C. neighborhoods in terms of a reduction in violent crime between 2014 and 2015. Hopefully this improvement will carry over into Halloween and will not cause visitors to and resident of these neighborhoods to be complacent.
Figure 1. Neighborhoods With Largest Halloween Crime Spike
Washington, D.C., as a whole, experienced an approximately 11.6 percent crime spike during Halloween Week (with a p-value of 0.22). This is primarily the result of more thefts, robberies, burglaries and thefts from cars, although there is also a large percentage increase in homicides and sex crimes as these crimes are relatively rare to begin with. Bottom line: be aware of your surroundings and don’t forget to lock your house and car doors.
Does your neighborhood have a Halloween crime spike? Look it up in Figure 2.
Figure 2. All Neighborhoods With Measurable Crime Spike
| Neighborhood | Halloween Crime Spike | Probability Spike Due To Random Chance |
|---|---|---|
| Howard University, Le Droit Park, Cardozo/Shaw | 40.30% | 0.30% |
| Capitol View, Marshall Heights, Benning Heigh | 39.00% | 0.60% |
| Eastland Gardens, Kenilworth | 34.10% | 12.80% |
| Brightwood Park, Crestwood, Petworth | 29.40% | 1.30% |
| Mayfair, Hillbrook, Mahaning Heigh | 28.40% | 6.70% |
| Edgewood, Bloomingdale, Truxton Circle, Eckington | 27.60% | 3.10% |
| Takoma, Brightwood, Manor Park | 26.20% | 6.10% |
| Southwest Employment Area, Southwest/Waterfront, Fort McNair, Buzzard Poin | 24.20% | 10.20% |
| Columbia Heights, Mt. Pleasant, Pleasant Plains, Park View | 21.60% | 3.20% |
| Georgetown, Burleith/Hillanda | 20.80% | 9.50% |
| Congress Heights, Bellevue, Washington Highland | 20.60% | 5.00% |
| Historic Anacostia | 18.80% | 18.80% |
| Twining, Fairlawn, Randle Highlands, Penn Branch, Fort Davis Park, Dupont Park | 18.50% | 12.80% |
| Shaw, Logan Circ | 18.20% | 9.40% |
| Fairfax Village, Naylor Gardens, Hillcrest, Summit Park | 15.50% | 22.00% |
| NoMa, Union Station, Stanton Park, Kingman Park | 13.60% | 16.50% |
| Douglass, Shipley Terrac | 10.70% | 25.20% |
| Woodridge, Fort Lincoln, Gateway | 9.10% | 32.70% |
| Spring Valley, Palisades, Wesley Heights, Foxhall Crescent, Foxhall Village, Georgetown Reservoi | 8.90% | 39.10% |
| Lamond Riggs, Queens Chapel, Fort Totten, Pleasant Hi | 8.70% | 33.90% |
| Friendship Heights, American University Park, Tenleytown | 8.60% | 32.90% |
| Kalorama Heights, Adams Morgan, Lanier Heigh | 8.00% | 31.60% |
| Woodland/Fort Stanton, Garfield Heights, Knox Hi | 7.20% | 35.30% |
| Dupont Circle, Connecticut Avenue/K S | 5.80% | 29.70% |
| Brookland, Brentwood, Langdon | 5.50% | 35.30% |
| Ivy City, Arboretum, Trinidad, Carver Langston | 4.70% | 36.00% |
| River Terrace, Benning, Greenway, Fort Dupon | 4.40% | 38.20% |
| North Cleveland Park, Forest Hills, Van N | 3.20% | 45.50% |
| Capitol Hill, Lincoln Park | 3.10% | 43.00% |
