The Energy Information Administration (EIA), the main federal agency responsible for collecting and analyzing energy statistics, has been rolling out an application programming interface (API), allowing developers to more easily access their vast statistical database. In our energy series, chart-it will use the EIA’s API to explore their database for interesting observations about the changing energy landscape in the U.S. and around the world. In this inaugural post, we take a look at the changing mix of fuels used for electric generation in the U.S. over the last fifteen years.
The EIA API database can be found here. The source code for the analysis can be found here. Also, you can find the Python wrapper around the EIA API that we developed for this analysis here.
Figure 1 shows the average monthly amount of electricity generated (measured in megawatt-hours) from each of the main fuel sources. The fuel mix has changed significantly over the last ten to fifteen years. There has been a dramatic reduction in the amount of electricity generated using coal, offset by an increase in the amount of electricity generated using cleaner burning natural gas. Production from nuclear power, which makes up the third largest share of the U.S. fuel mix, has been steady since 2001 as the U.S. has not built a new nuclear power plant since the 1970s.
While electricity generation from wind and solar power has grown significantly over this period, renewable energy remains a small blip in the overall U.S. generation portfolio, as shown in Figure 2 below. In fact, using a consistent y-axis scale for all of the fuel sources, only coal, natural gas, conventional hydro and nuclear (which together generate more than 90 percent of U.S. electricity supply) would be visible, a stark reminder of how little electricity the U.S. currently generates from renewable sources.
Figure 1. Average Monthly U.S. Electricity Generation by Fuel Type (Thousand Megawatt-hours)
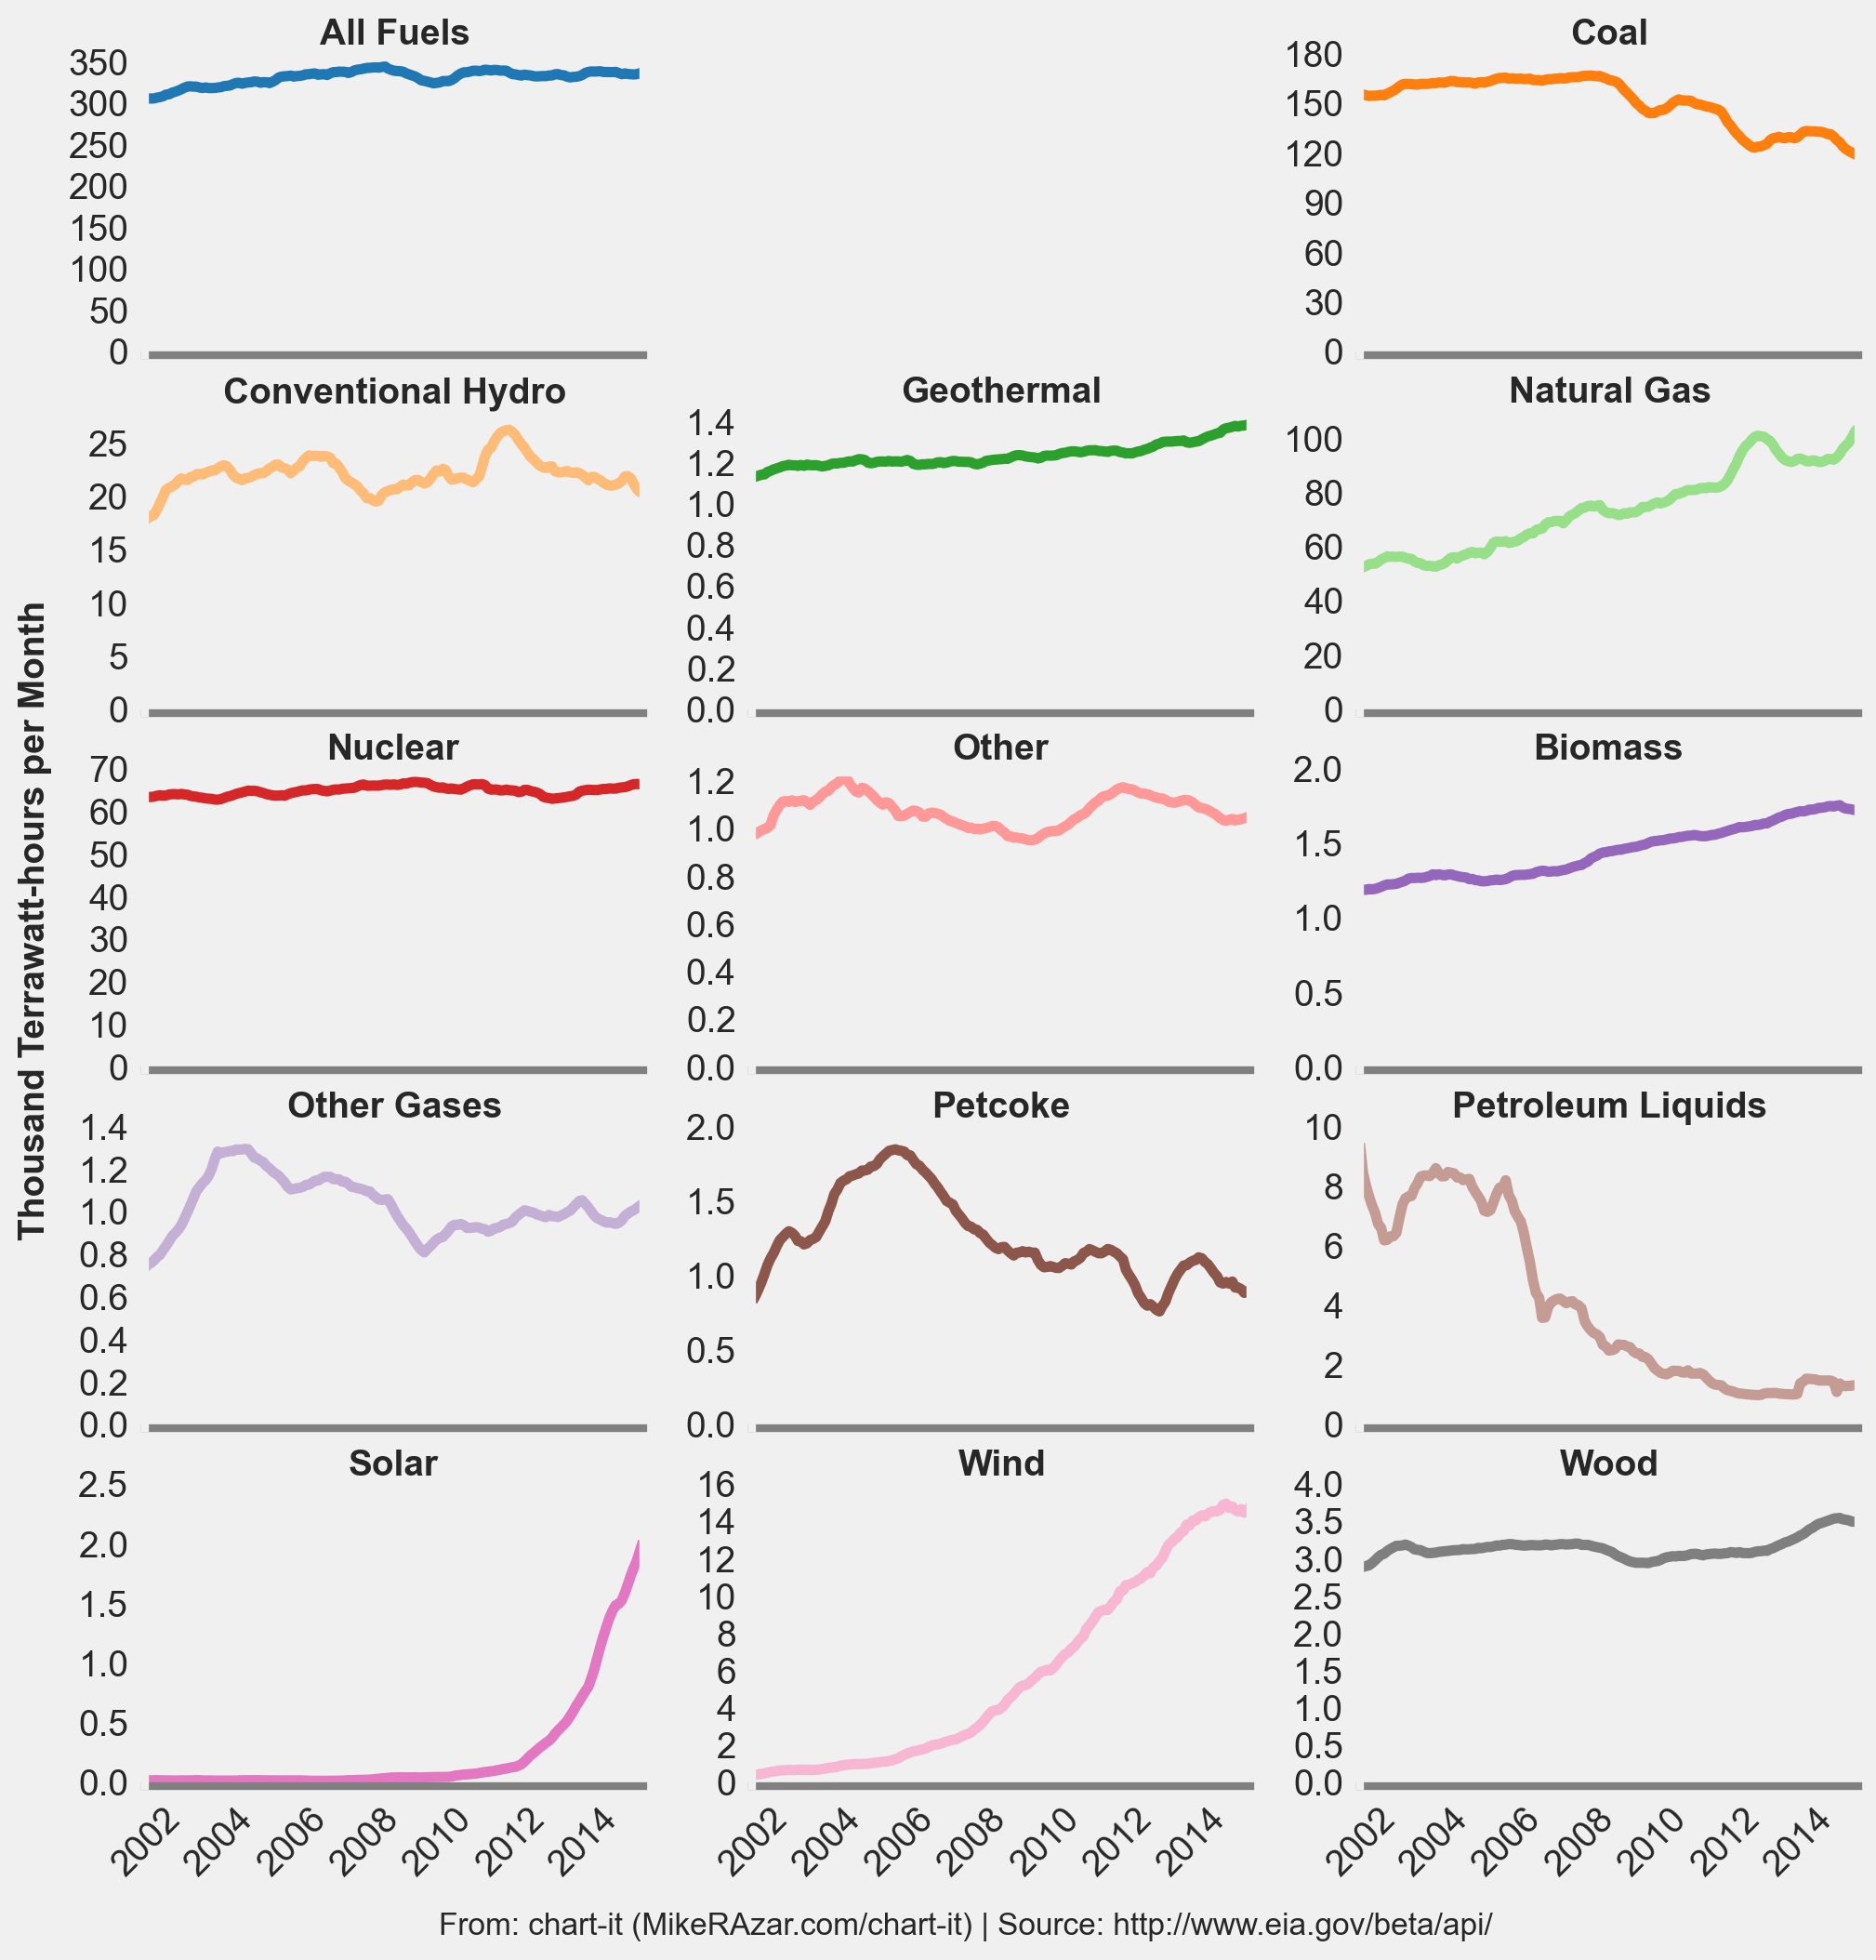
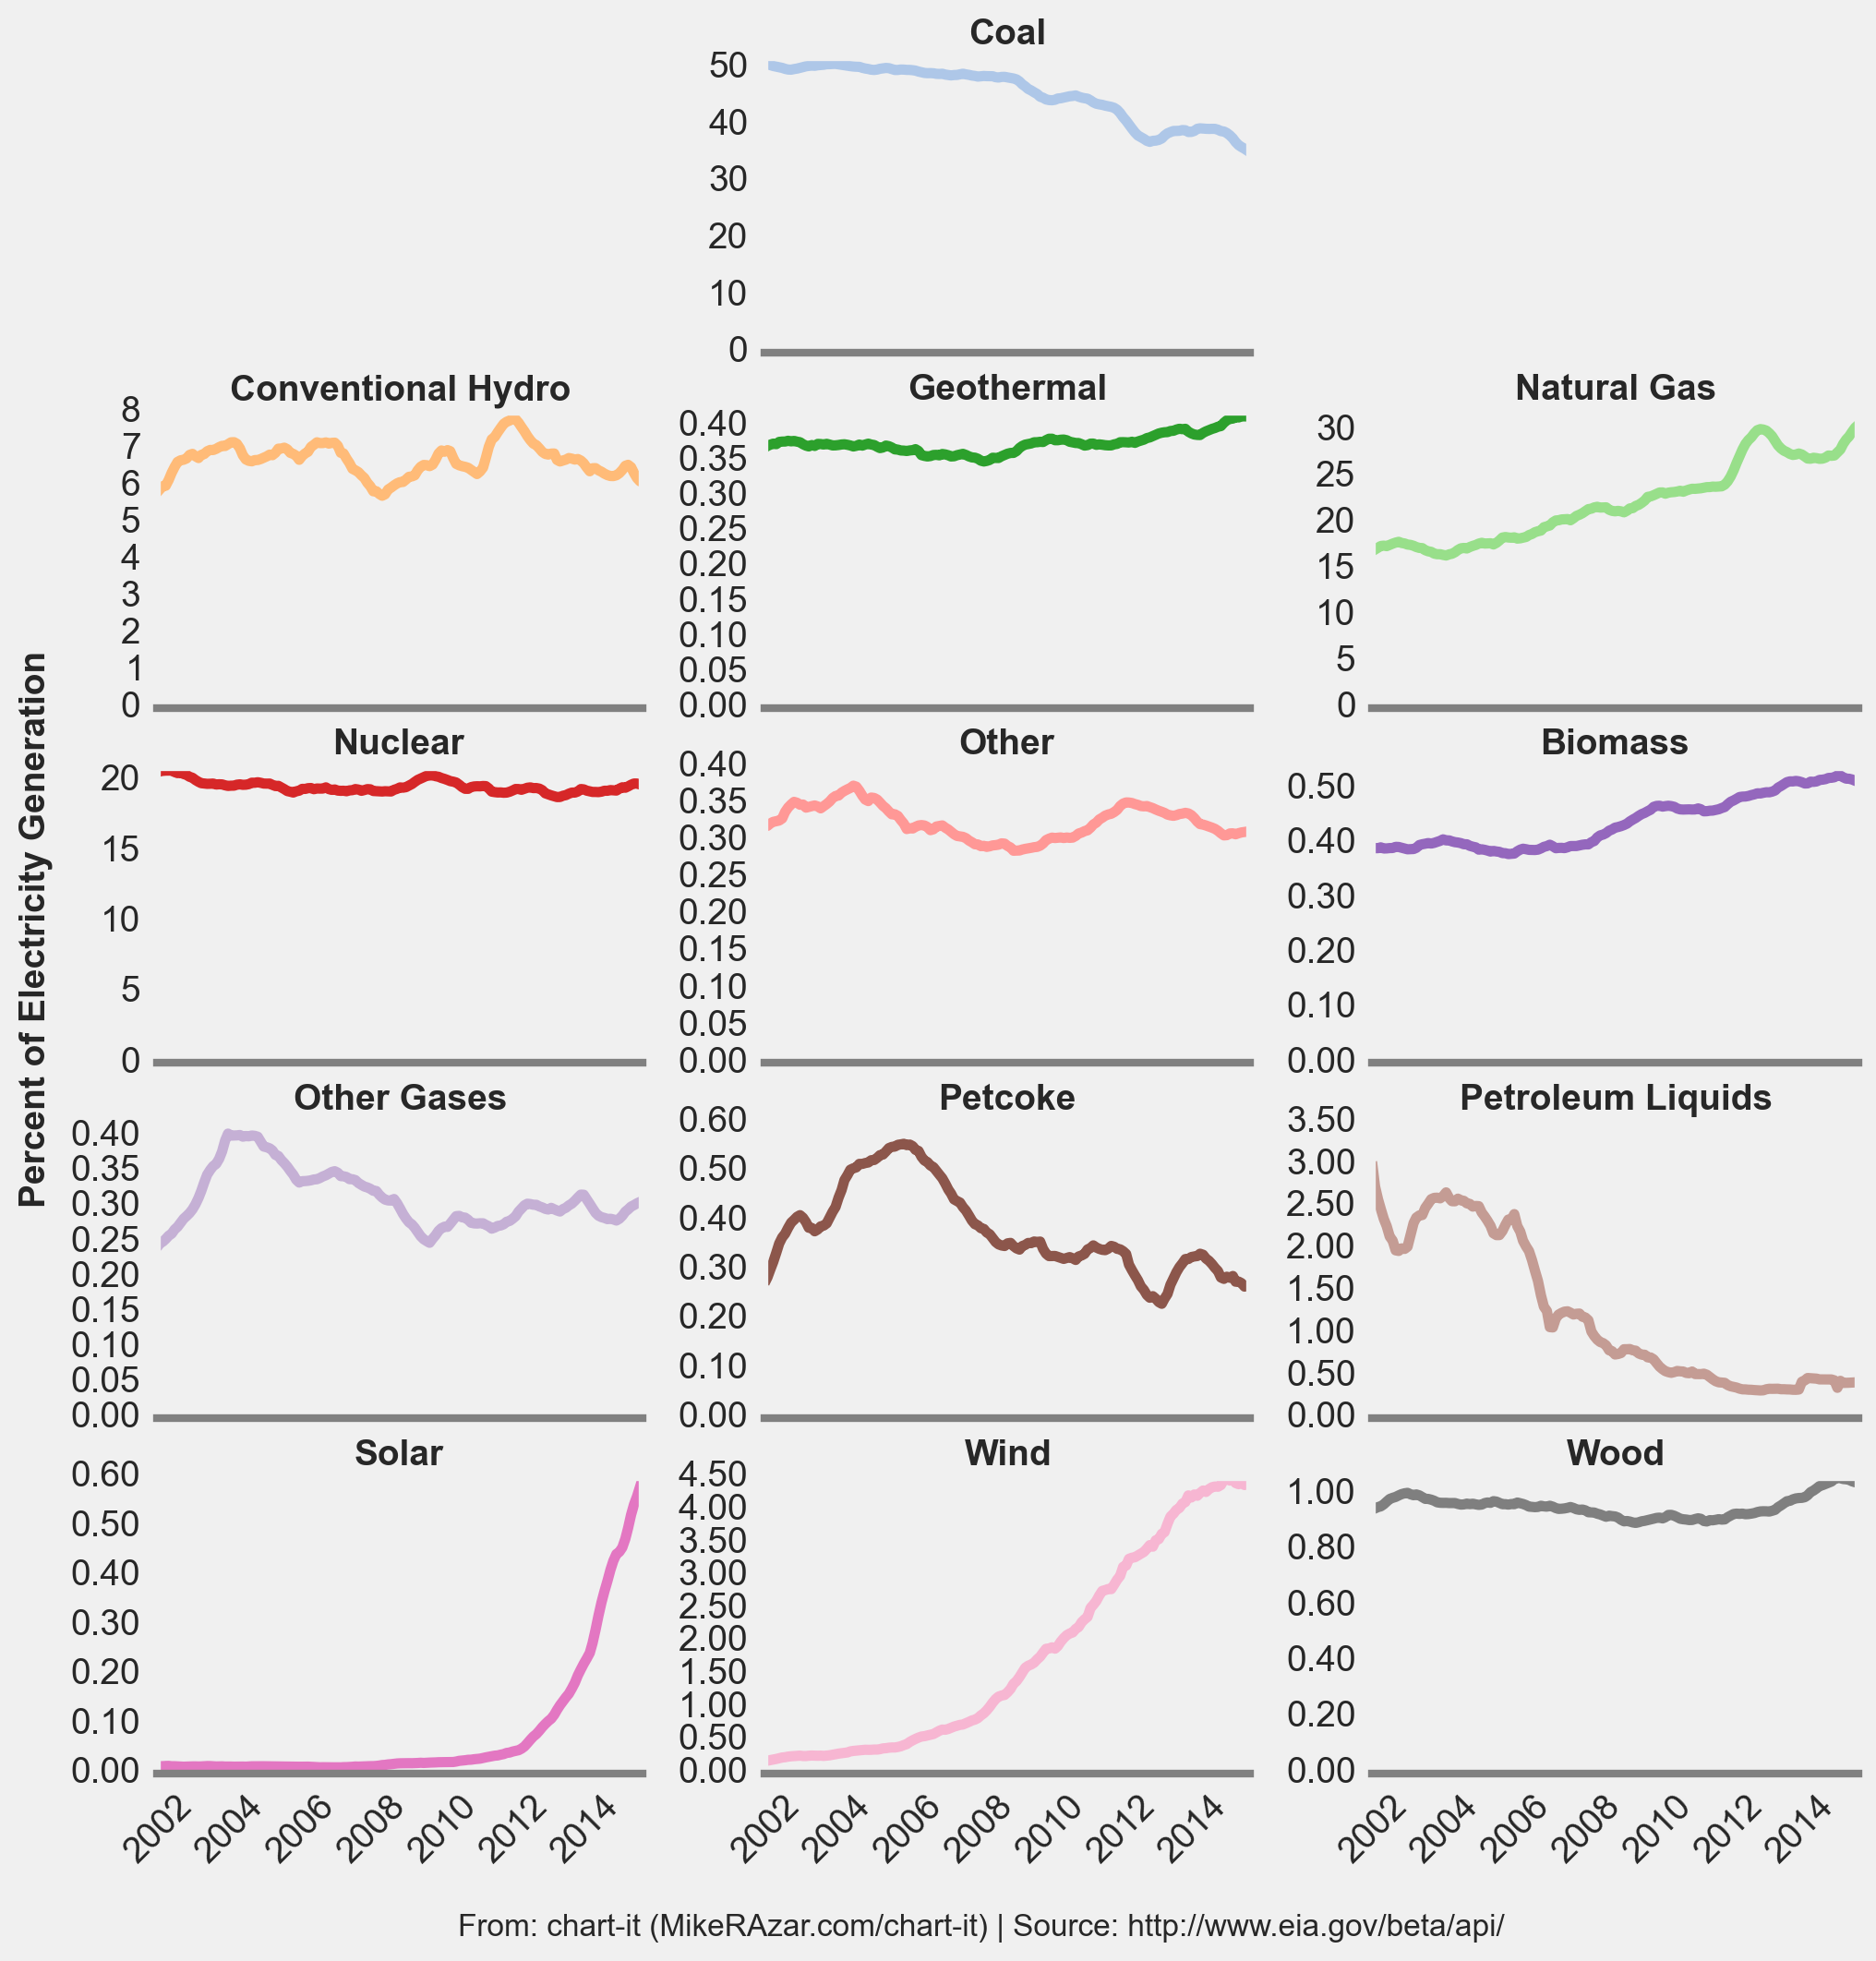
Figure 2 shows the average monthly amount of electricity generated from each fuel source as a percentage of total U.S. electricity supply. Coal’s contribution has dropped from nearly 50 percent fifteen years ago to about 30-35 percent today. The fall in coal consumption accelerated in 2008, coinciding with a drop in electricity demand in the U.S. due to the economic recession and a significant fall in U.S. natural gas prices due to the shale gas supply glut.
Meanwhile, natural gas’ share has doubled from around 15 percent to 35 percent during the same period. Natural gas is a fossil fuel that burns cleaner than coal and has been in plentiful supply (and low price) as a result of hydraulic fracturing drilling technology. This has helped wean the U.S. off of much dirtier coal.
Wind, practically non-existent fifteen years ago (even as recently as ten years ago), now contributes about 4.5 percent of the U.S. electricity supply. Solar has also grown significantly but still contributes just about 0.6 percent. Despite substantial efforts to grow the U.S. renewable portfolio, wind and solar still only make up a small fraction of our electricity generation. Wind and solar capacity will need to grow at a pace much faster than conventional fossil and nuclear power to increase their share of electricity production because of their relatively low capacity factors (the percentage of hours during which they are actually producing electricity, i.e., when the wind blowing or sun shining). Conventional fossil and nuclear power plants generate 2-4x as much electricity as a wind or solar plant of equivalent capacity. As a result, significantly more wind and solar capacity is needed to produce the equivalent amount of megawatt-hours that conventional fossil and nuclear power plants produce.
Figure 2. Average Monthly U.S. Electricity Generation by Fuel Type (Percent of Electricity Generation)
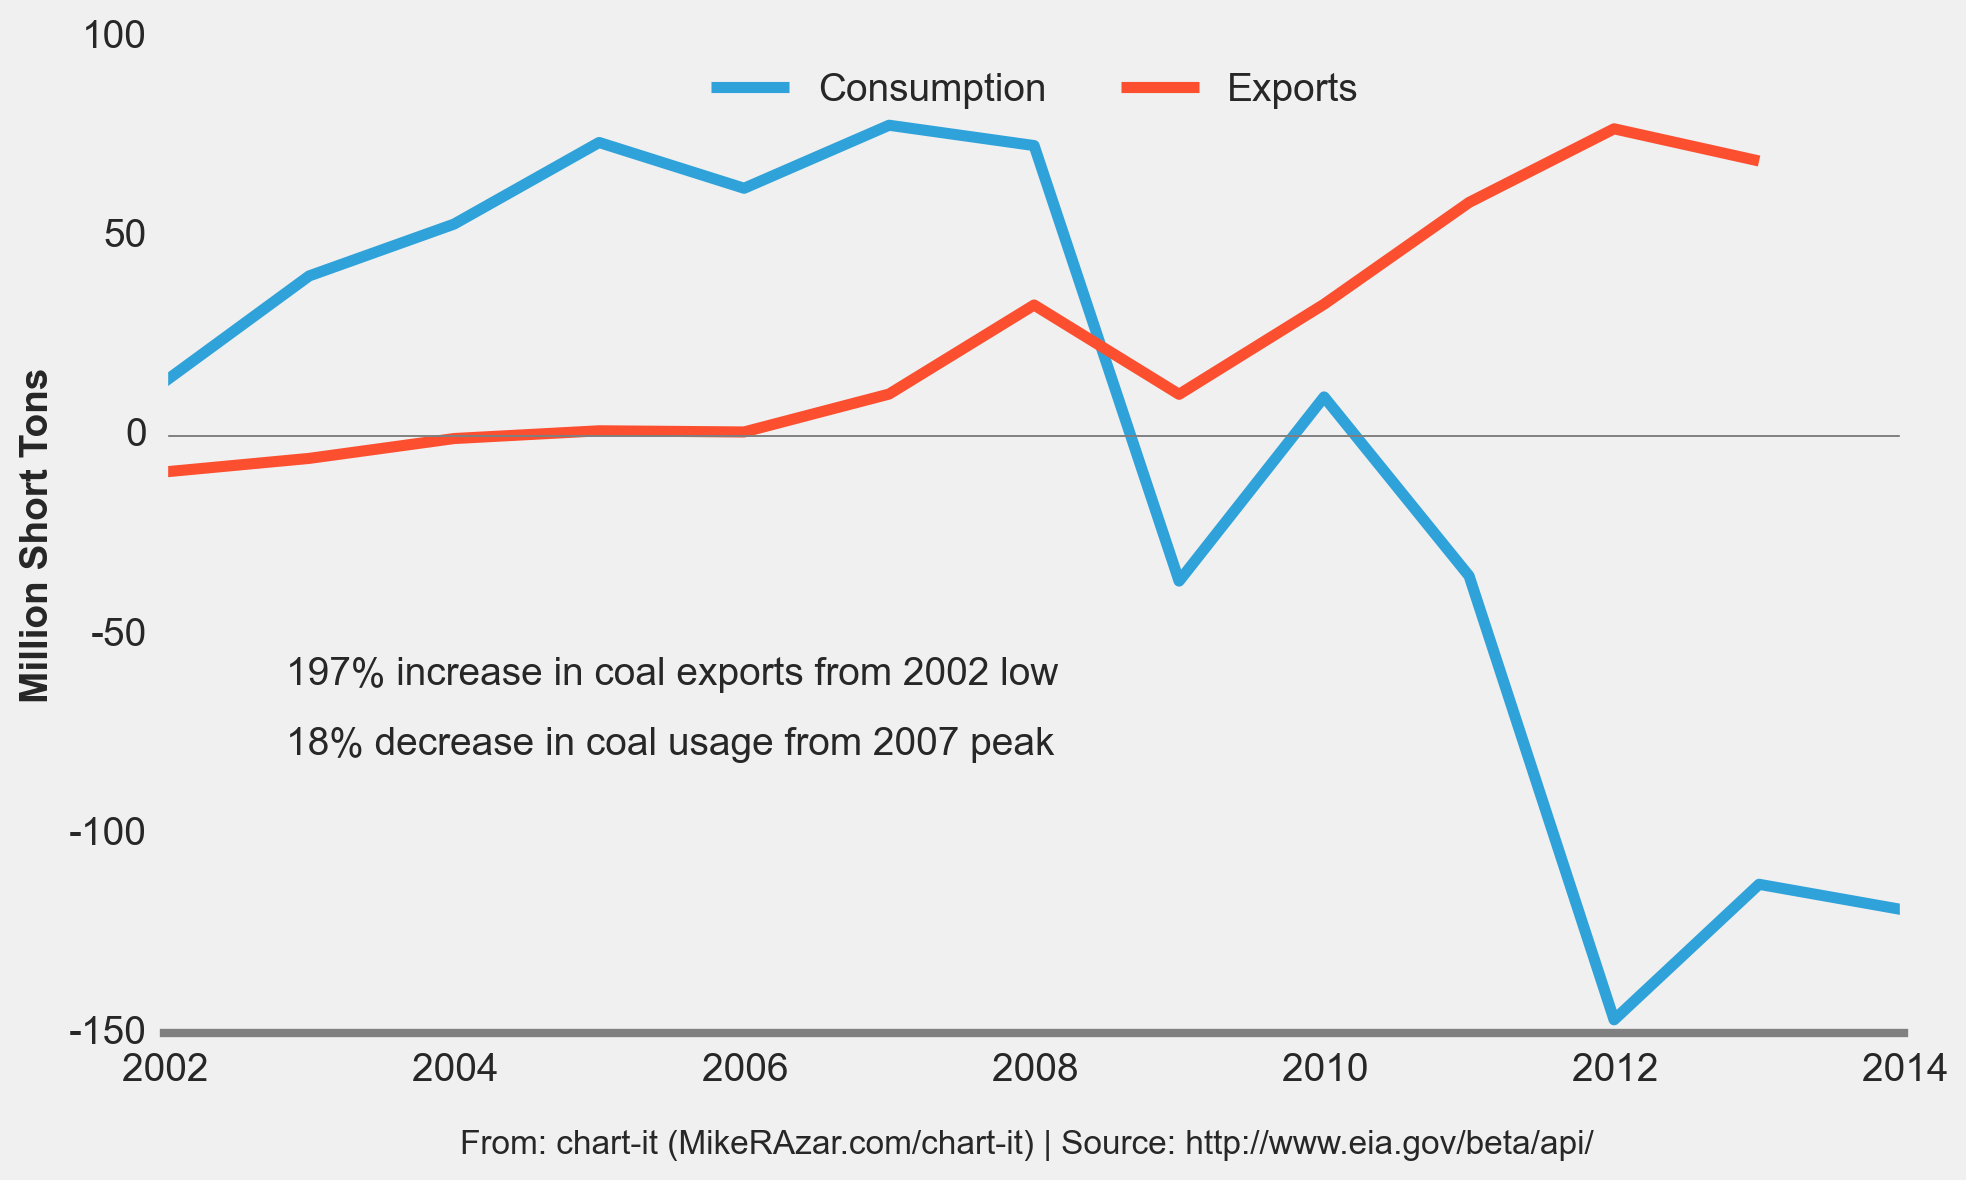
What, then, is happening to all of the coal that the U.S. used to consume in electricity generation? Figure 3 shows the cumulative change in U.S. coal consumption and coal exports from 2001. While coal consumption in the U.S. has dropped by nearly 130 million short tons per year since 2001 (a more dramatic 200+ million short tons, or 18 percent, drop from the 2007 peak), coal exports have grown by about 60 million tons since 2001 (a 197 percent increase). The U.S. may be burning less coal to generate electricity, but we’re shipping much more of it all over the world so that others may burn it instead. Which countries are taking our coal exports?
Figure 3. Cumulative Annual Change in U.S. Coal Consumption and Exports from 2001
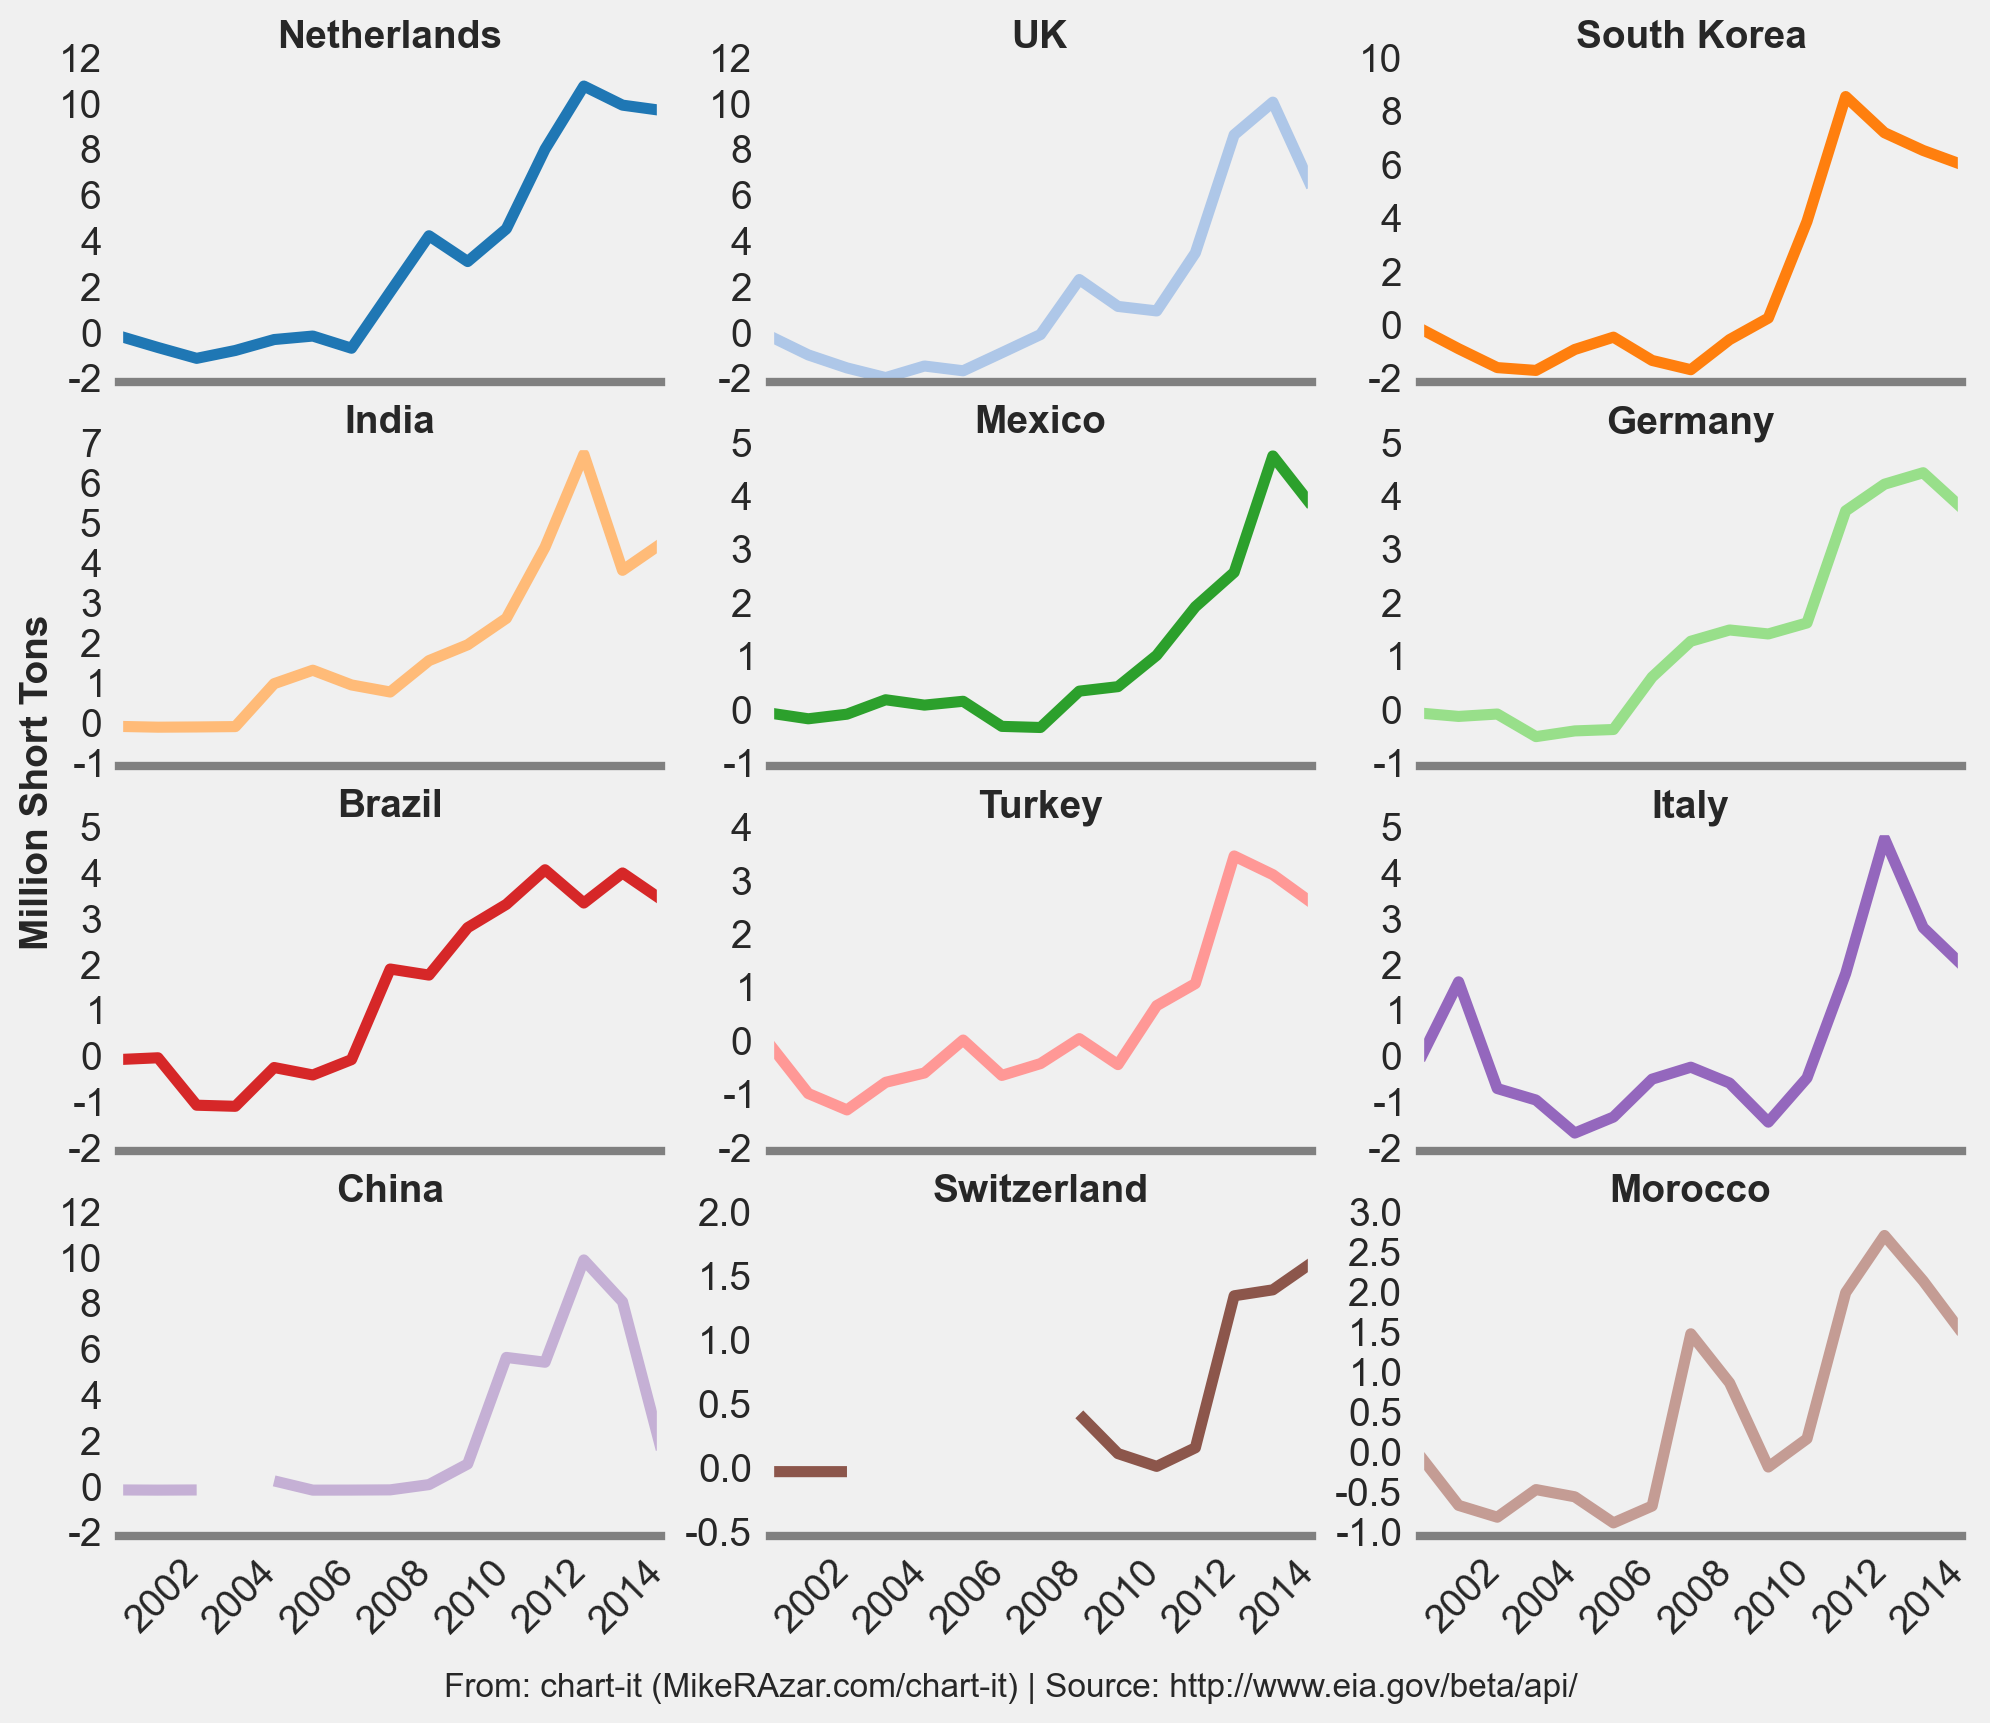
Figure 4 shows the cumulative change in coal exports from the U.S. to selected countries that have seen the largest increase in their share of U.S. coal exports since 2001. The Netherlands, a country with a population of just 17 million people, has taken the largest share of our growing coal exports. After a bit of research, we discovered that the Netherlands is not actually ramping up its construction of coal-fired power plants. As it turns out, the ports at Rotterdam and Amsterdam serve as major transshipment points for coal to other European countries. Most of the U.S. coal exports to the Netherlands are likely exported onward to other European countries.
Figure 4. Annual Growth in U.S. Coal Exports to Certain Markets
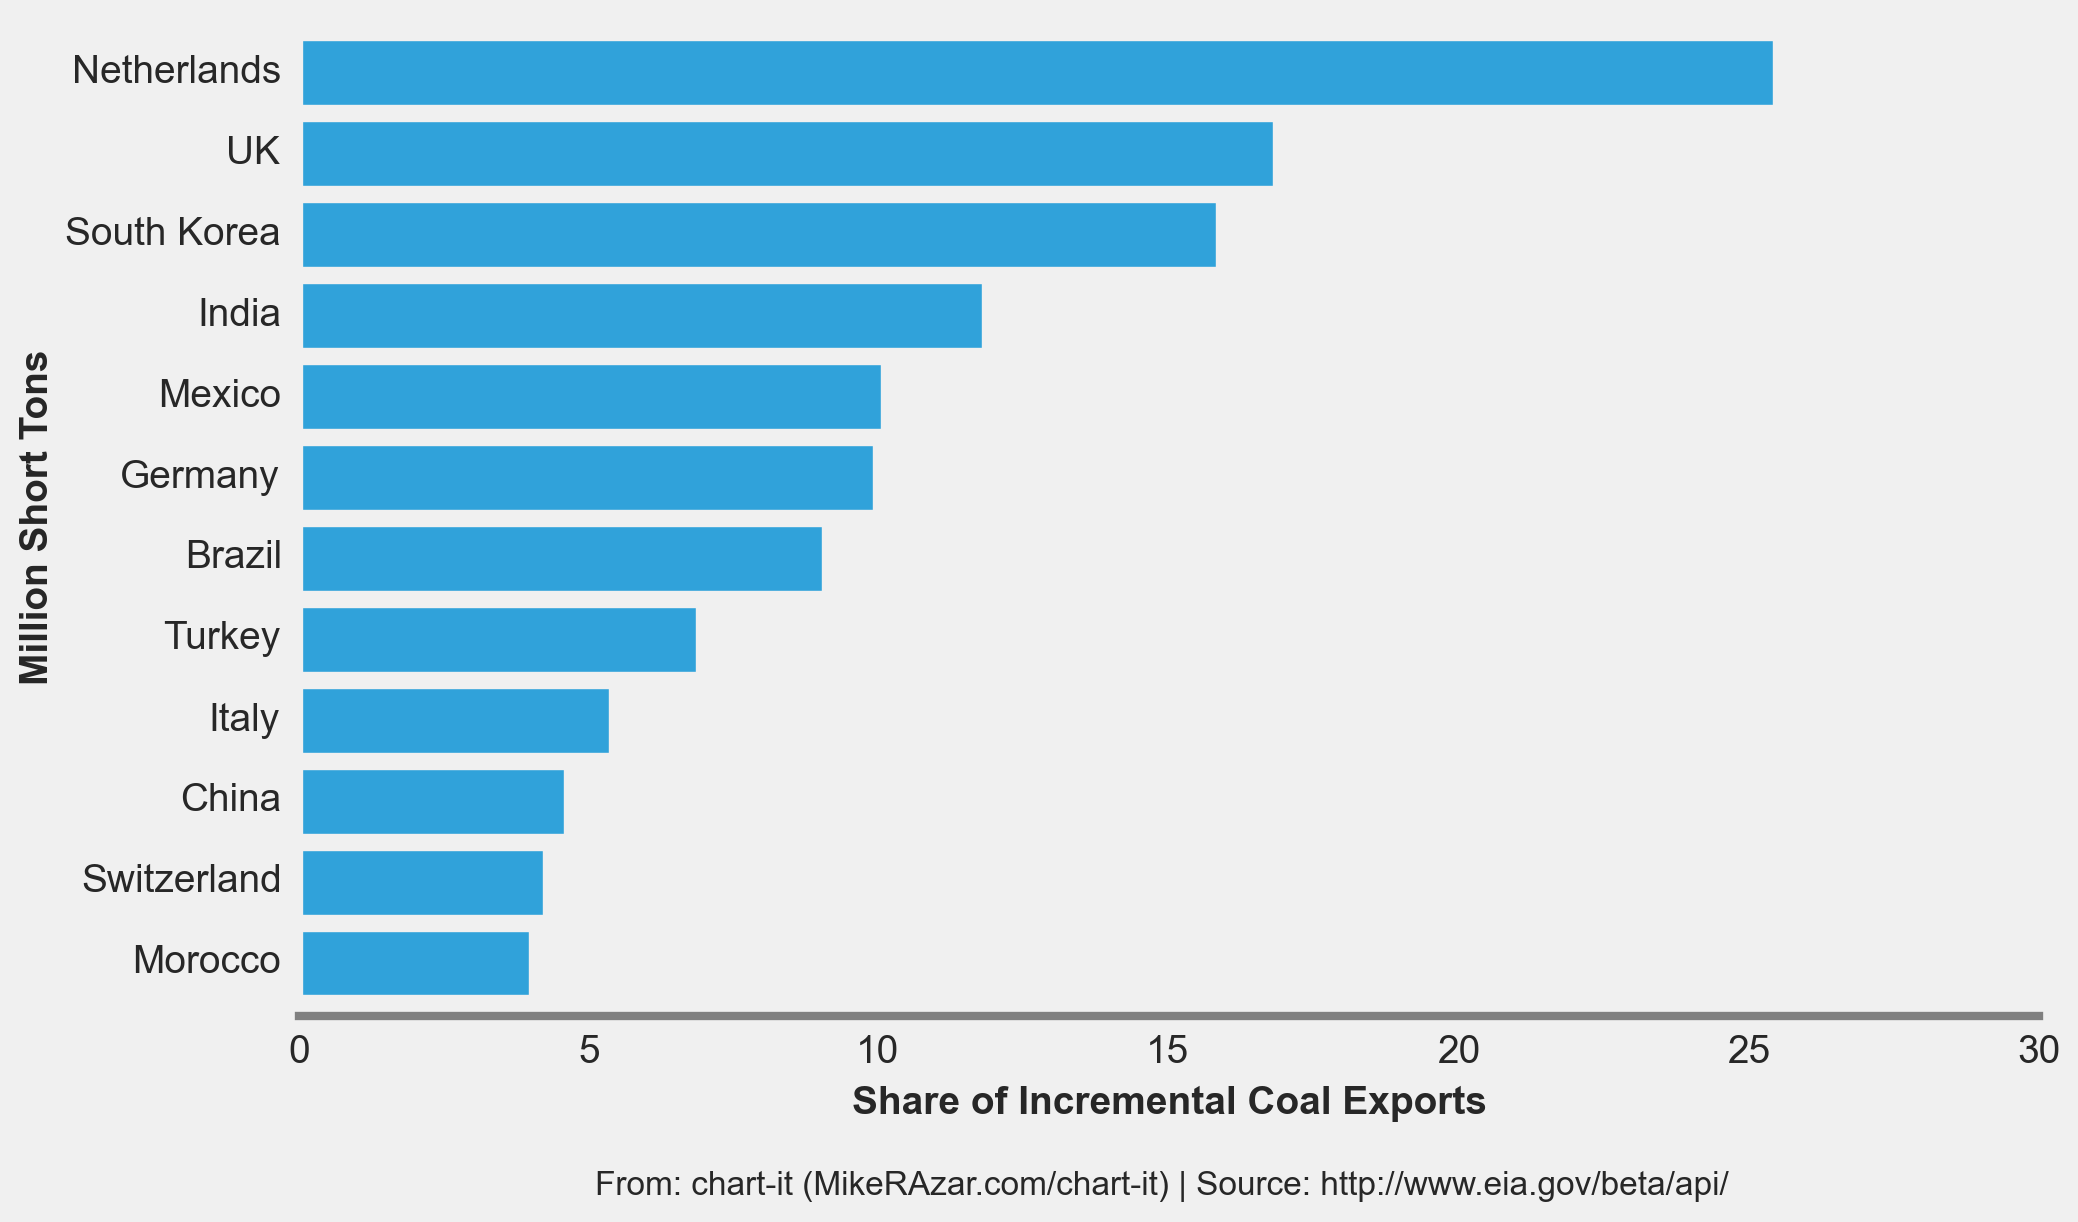
Figure 5 shows each country’s percentage share of the incremental growth in U.S. coal exports since 2001. Nearly two-thirds of the U.S.’s new exports supply is shipped to various European countries, most of whom have not embraced fracking as the U.S. has (many have banned fracking). As a result, the price of natural gas is significantly lower in the U.S. than in Europe, which has accelerated the shift from coal to natural gas in the U.S. power sector (environmental regulations have also played a major role of course). Other countries, particularly Germany, have also begun to decommission their nuclear power fleet, which has put additional strain on electricity supply. Despite generous subsidies for renewable power, many European countries have had to fall back to coal power to meet baseload and peak energy demand, as reflected by the significant increase in U.S. coal exports to Europe.
wow, awesome article post.Much thanks again. Fantastic. Phommatheth