Earlier this week, we compared the drop in the price of crude oil in December 2014 to the historical volatility of crude oil prices to understand the magnitude of the change. Today, we’ll explore the historical relationship between crude oil prices and economic growth. We note that many research papers have been written on this topic and this write-up is not meant to be a comprehensive, academic-level analysis of the precise predictive relationship between oil prices and growth. It is simply intended to provide a general framework for measuring and understanding the relationship.
Does the drop in crude oil prices in 2014 tell us anything about economic growth in 2015? As it turns out, we can statistically measure the relationship between changes in oil prices and economic growth. The chart below plots the change in the average annual price of West Texas Intermediate crude oil (a U.S. price benchmark) from the previous year against the change in real gross domestic product (real GDP) in the U.S. for every year from 1986 to 2014.
Does the drop in crude oil prices in 2014 tell us anything about economic growth in 2015? As it turns out, we can statistically measure the relationship between changes in oil prices and economic growth. The chart below plots the change in the average annual price of West Texas Intermediate crude oil (a U.S. price benchmark) from the previous year against the change in real gross domestic product (real GDP) in the U.S. for every year from 1986 to 2014.
Figure 1. Change in the Price of Oil v. GDP Growth
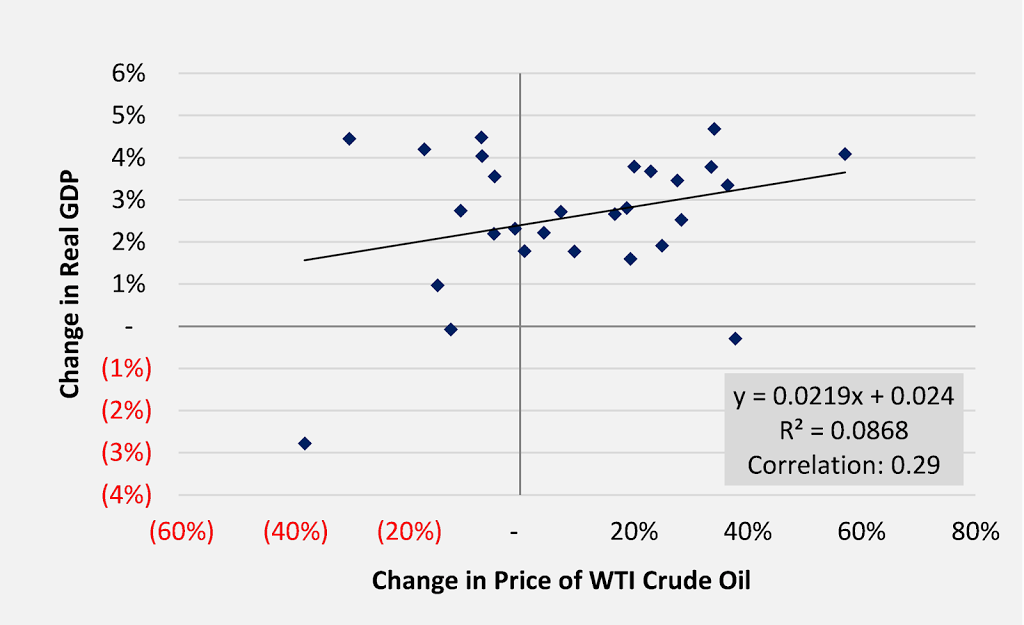 |
| Source: Energy Information Administration, Federal Reserve Bank of St. Louis |
We might expect that a decline in oil prices is correlated with higher economic growth. The chart suggests the opposite. An increase in the average annual price of oil seems to be correlated with higher GDP growth[1]. The R2, which measures the percentage of GDP growth that is explained by the the change in the oil price, is 8.7 percent.
Perhaps the correlation above is just telling us that a strong economy is associated with higher demand for oil and, therefore, a higher oil price. It likely takes some time for the rising price of oil to feed into the broader economy and begin to have negative effects. Let’s see what the results look like if we plot the change in the price of oil against real GDP growth in the next year.
Figure 2. Change in the Price of Oil v. Next Year’s GDP Growth
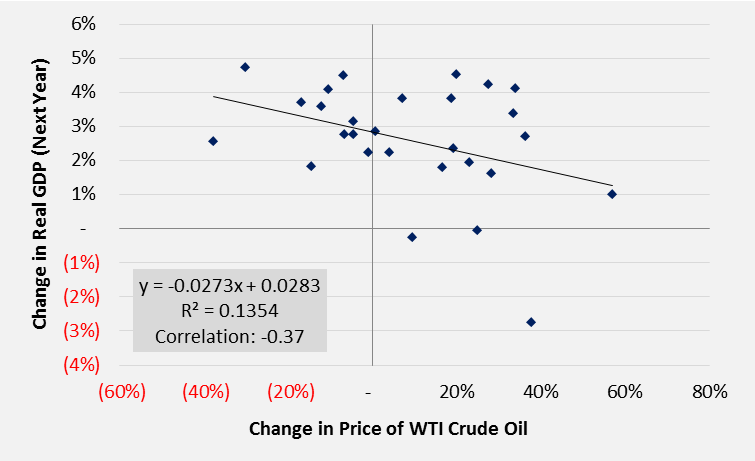
That makes more sense. The chart above suggests that rising oil prices are negatively correlated with real GDP growth in the next year (i.e., higher oil prices are correlated with lower GDP growth in the next year). The R2 is also higher at about 13.5 percent. The change in the oil price seems to be a little better at explaining the change in the next year’s real GDP growth rate, although the relationship is not especially strong.
Certainly there are many variables other than the price of oil that drive economic growth. Let’s plot the relationship between economic growth in one year and growth in the next year as a “catch all” for all of these other variables which change in one year and have an impact on growth in the next year. This is a highly simplified approach but it’s acceptable for our purposes.
Figure 3. GDP Growth v. Next Year’s GDP Growth
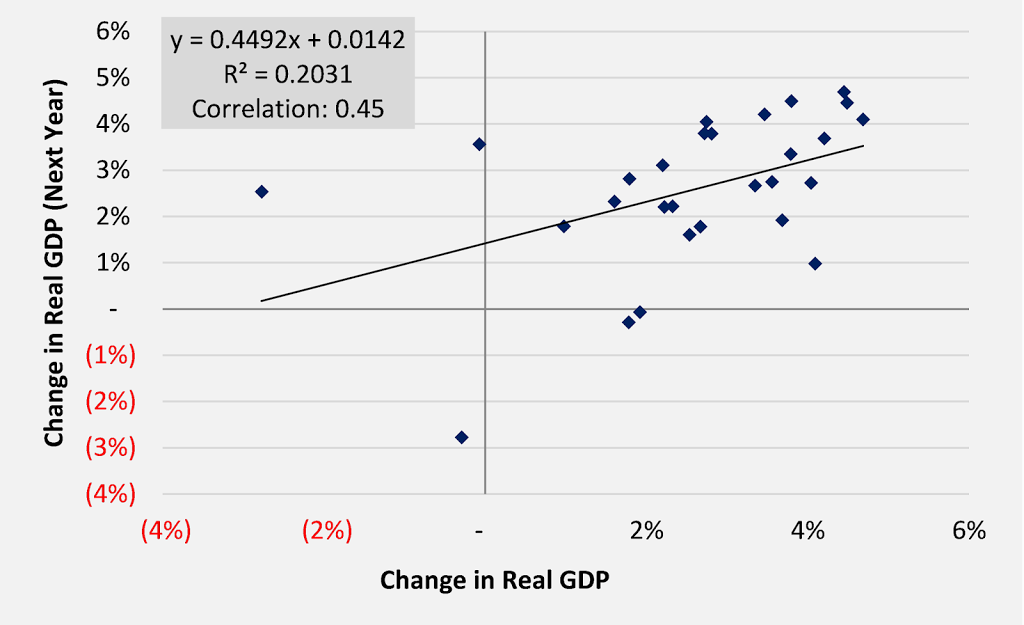
As suspected, there is a relationship and a positive one with an R2 of 20.3 percent. Let’s try combining both explanatory variables (i.e., the change in the price of oil and GDP growth) to measure how well they predict the next year’s economic growth rate on a combined basis.
The R2 of that regression is 47.8 percent, meaning that the change in the price of oil and the change in real GDP together explain approximately 47.8 percent of the next year’s GDP growth rate. The relationship is statistically significant for both variables. The standard error is 1.2 percent, meaning that we can say with 95 percent confidence that the actual GDP growth rate in the forecast year will be within +/- 2.4 percent (two standard errors) of the predicted value. That is a pretty wide margin if the intent is to produce a precise GDP growth forecast. While this model may not be effective at producing such a forecast, it could provide some general insight into next year’s GDP growth rate based on the historical data.
Let’s look at historical GDP growth rates versus what would have been predicted by our regression model. The dotted red lines reflect the 95 percent confidence interval for each predicted value.
Figure 4. Predicted v. Actual GDP Growth
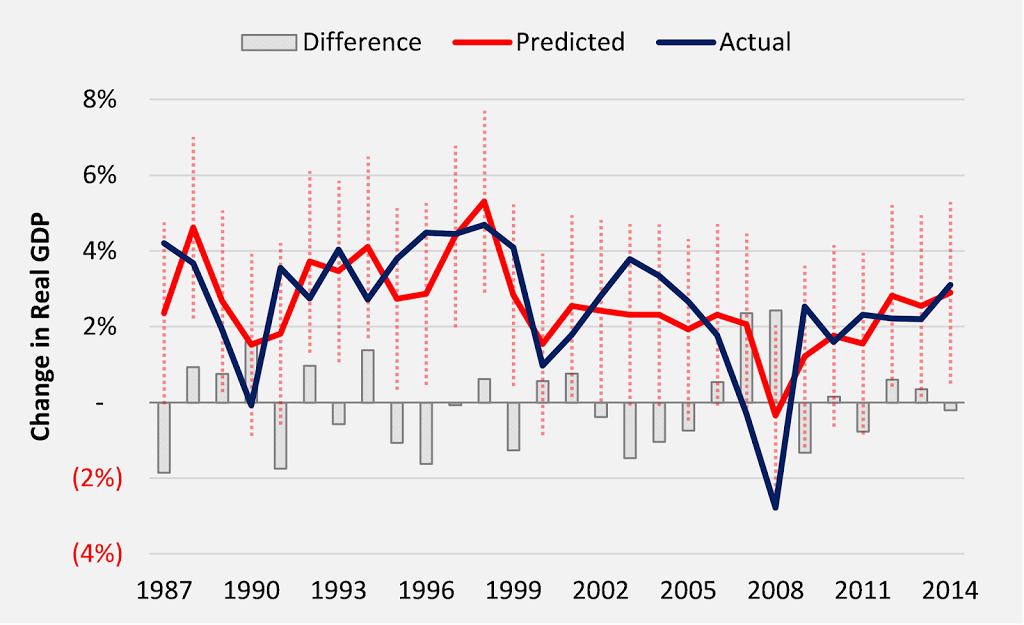
The model seems to track the observed values reasonably well. Now, what does this model say about the GDP growth rate in 2015? Based on the change in oil prices in 2014 and the latest estimate of real GDP growth in 2014, economic growth is forecast to be 2.9 percent in 2015. We can say with 95 percent confidence that growth will fall between 0.5 and 5.3 percent, and with 68 percent confidence that growth will fall between 1.7 and 4.1 percent, compared to 2.2 percent growth in 2014. As noted above, these wide margins make this crude regression useless for deriving a precise forecast of next year’s GDP growth. However, the model does suggest in general that based on the historical relationships between the variables described above, economic growth in 2015 is likely to be stronger than last year. For reference, the IMF currently projects the U.S. economy will grow by 3.1 percent in 2015, just 0.2 percent higher than our model’s estimate.
[1]The correlation is 0.29, which suggests that the two variables tend to move together (i.e., higher oil prices are correlated with higher GDP growth). A negative correlation suggests that the two variables move in opposite directions.
Well, labels on the graphs are probably a good way to make this a great deal more interesting.
There are labels on all of the charts.
What a neat arielct. I had no inkling.
“Thanks a lot for the article post. Great.”