This is part two of our four-part series exploring system data from the DMV area’s Capital Bikeshare system. This post is all about the sturdy workhorse of the bikesharing system, the bright red bike-tank that has become a staple of the DC backdrop. We’ll explore bike activity and workload patterns based on data from 2.9+ million bikeshare rides taken in 2014, and give a special shout out to the hardest working bike of the year. The series covers the following topics:
- Part 1 explores the riding patterns of Bikeshare members in 2014.
- Part 2 looks at bike activity and workload patterns in 2014.
- Part 3 explores popular routes and stations in during the year ending June 2015.
- Part 4 will explore trends over the period from 2010 to the first half of 2015.
Active Bikes
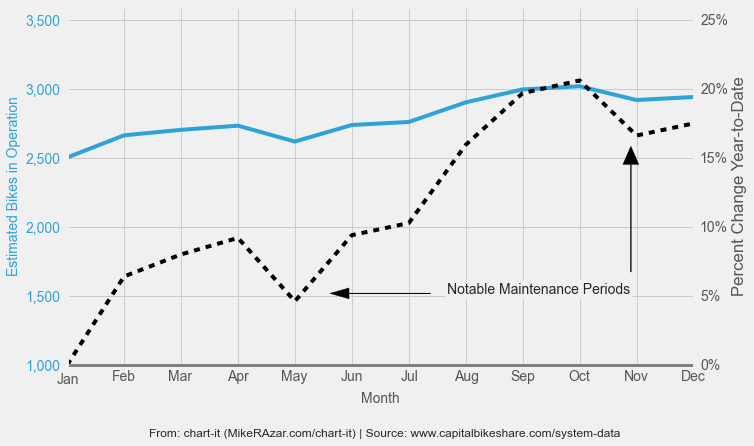
Capital Bikeshare’s popularity can be measured by the growing number of active bikes in the system. As shown in Figure 1 below, the system started the year with about 2,505 active bikes in January and ended the year with close to 2,944 active bikes in December, an increase of 17.5% (or 439 bikes). There were 3,207 unique active bikes during 2014, about 263 bikes more than the 2,944 that were active in December. It is likely that these 263 bikes were either retired or offline for maintenance in December.
The data also shows two notable drops in the number of active bikes, the first in May, after the April spike in system usage (identified in part one of our series), and the second in November, right after the busy summer/fall season. We suspect that these are due to an increase in bike maintenance or retirements following high system usage periods. In October, just before the second maintenance period, there were 3,022 active bikes, the most in any month during 2014, reflecting a 21% increase in active bikes from January.
Figure 1. Active Bikes During 2014
Only 1,619 bikes were active in every single month during 2014. This suggests that about half of the bikes in the system were down for maintenance or otherwise idle for at least one month in 2014. We don’t have a benchmark to compare this metric against, but we will explore it further during part four of the series, when we look at system trends of over time.
Average Bike Workload
A summary of the workload across bikes in the system is shown in Figure 2 below. The average full-time bike (full-time bikes are the 2,292 bikes that operated in both January and December to exclude bikes that either entered or exited service part-way through the year) carried out 1,027 rides for a total of 292 hours in 2014. However, there is a disparity in workload across bikes as measured by the standard deviation. We explore the distribution of the workload among full-time bikes further in the next section.
Figure 2. Full-Time Bikes – Workload Summary Statistics
| Total Rides (#) | Total Hours (hours) | |
|---|---|---|
| Median: | 1,027 | 292 |
| Standard Deviation: | 255 | 78 |
| Minimum: | 62 | 15 |
| 25 th percentile: | 842 | 234 |
| 75 th percentile: | 1,178 | 336 |
| Maximum: | 1,649 | 483 |
Bike Workload Distribution
The workload is generally not equitably distributed among the bikes in the Capital Bikeshare system. There are two ways to measure how hardworking a bike is: number of rides undertaken and total hours ridden.
As shown in Figure 3, there is a disparity in the number of rides taken by full-time bikes in 2014. For example, the busiest 15% of bikes carried out about 72+% more rides during the year than the least busy 15% (that’s more than 44 rides per month). The magnitude of the disparity is similar even if the analysis only considers the 1,619 bikes that were active in every single month of 2014.
Figure 3. Distribution of Workload by Number of Rides
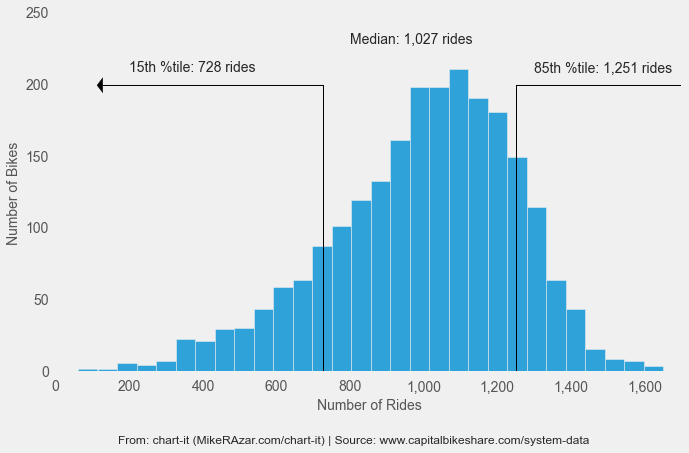
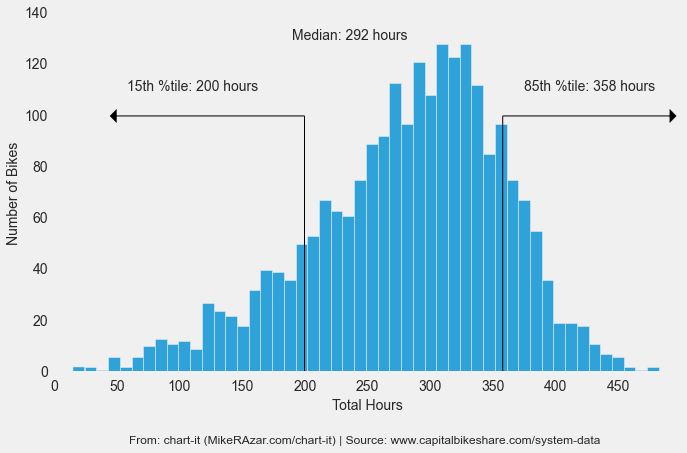
Figure 4 shows a similar disparity in the total hours logged by each full-time bike. The average biked registered about 292 hours (12 days) of rides in 2014. The busiest 15% of bikes registered 79+% more hours than the least busy 15% of bikes (that’s more than 159 hours).
Figure 4. Distribution of Workload by Total Hours
Hardest Working Bike of 2014
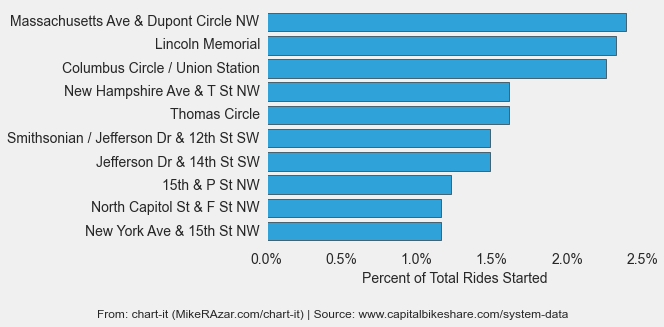
Where does W20167 spend most of its time? Figure 5 below shows the top ten stations from which W20167 trips originated in 2014. Not surprisingly, these are some of the busiest stations in the system. Stay tuned for part three of the series, which will explore patterns related to bike stations and routes.
Figure 5. Most Frequented Stations by Hardest Working Bike
Thank you for posting the great content…I was looking for something like this…I found it quiet interesting, hopefully you will keep posting such blogs….Keep sharing
mountain bike wheels
Your way of telling everything in this post is in fact
fastidious, every one can simply understand it, Thanks a lot.
My brother suggested I might like this blog.
He was totally right. This publish truly made my day. You cann’t consider just how much time
I had spent for this info! Thank you!
Thanks for sharing such a nice idea, article is pleasant,
thats why i have read it entirely