This is part four of our series exploring data from the DMV area’s Capital Bikeshare system. Today’s post, which comes after a short four-year hiatus, is a retrospective exploring the nine-year evolution of the Capital Bikeshare system, which just marked its 25 millionth ride, an incredible achievement. Read on to discover Bikeshare’s hardest working bike, along with the busiest stations and routes, since the inception of the System.
In the first two parts of the series, we examined rider and bike patterns. In the third, we explored popular routes and stations. We encourage you to read the previous parts here:
- Part 1 explores the riding patterns of Bikeshare members.
- Part 2 looks at bike activity and workload patterns.
- Part 3 explores popular routes and stations.
- Part 4 explores the evolution of the System from 2010 to 2019.
The Capital Bikeshare system data can be found here. The source code for the data analysis can be found here and here (for system age analysis).
The Riders
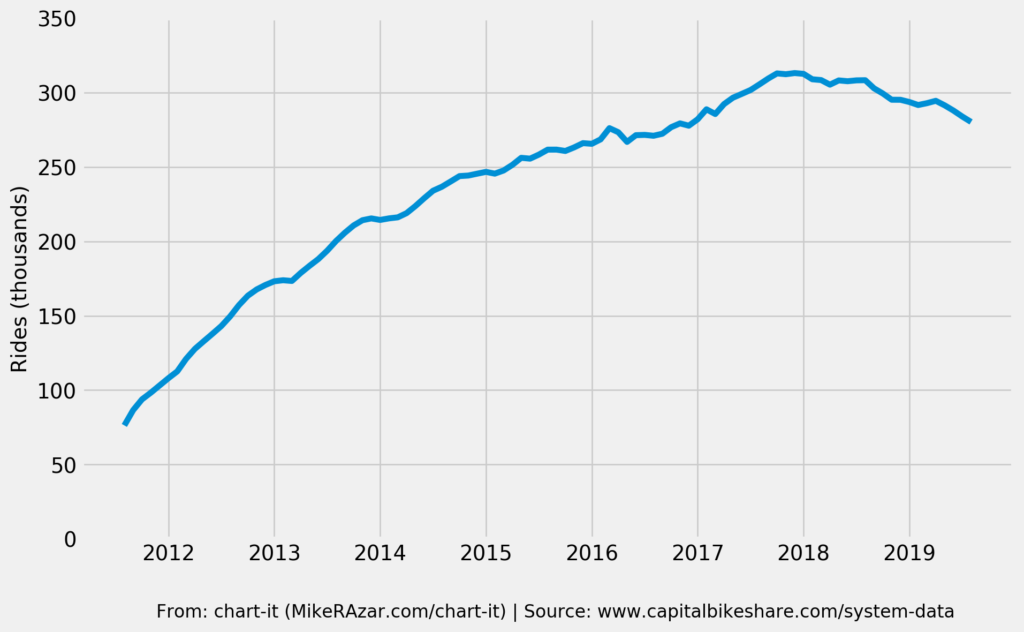
Figure 1 below shows the average monthly number of rides since 2010 (on a 12-month rolling average basis to smooth out the seasonal variations). In Bikeshare’s first year, the system reported an average of about 75,000 rides per month. The system expanded rapidly over the following years, peaking at just more than 310,000 rides per month in 2017 (that’s more than 3.7 million rides per year!). Over the last two years, however, system usage has fallen steadily to 280,000 monthly rides, with the decrease showing no signs of abating. More information is needed to understand the cause of falling ridership but, seeing as DC hosted a record number of tourists in 2019, it is likely a result of new transportation options in the District, including ridesharing (Uber/Lyft), dockless bikes and scooters, etc. This blogger would like to know how falling ridership is factoring into Capital Bikeshare’s system planning and how the company is responding to competition from alternative transportation options.
Figure 1. Average Monthly Rides (12m Rolling Average)
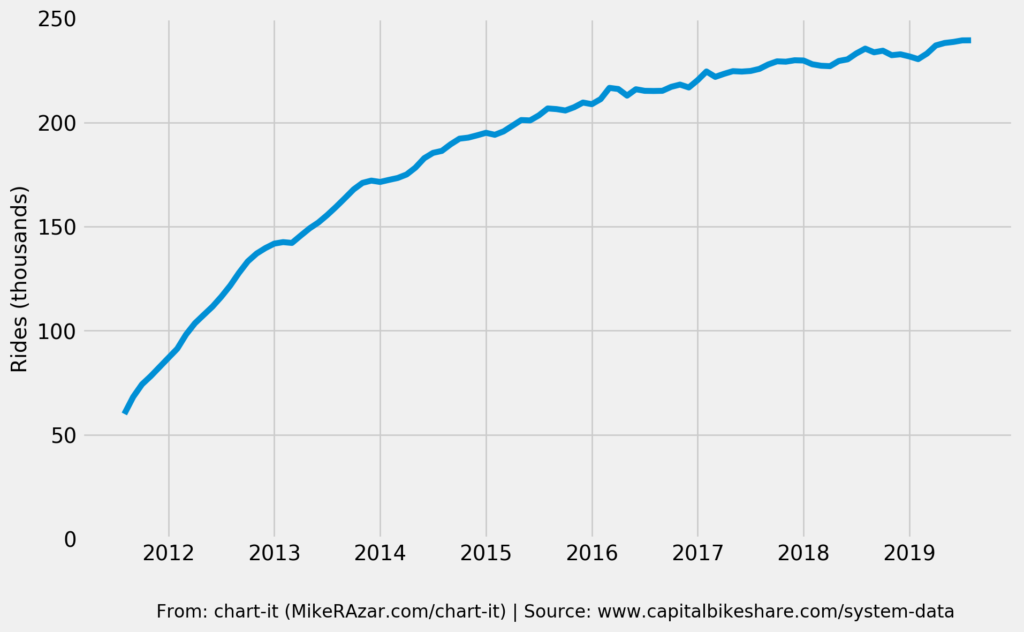
There are two types of Bikeshare riders: Registered riders who have an annual membership (typically DMV residents) and Casual riders who purchase short-term passes (a mix of DMV residents and visitors). Because each group has its own unique behavioral patterns, we analyzed each group separately in Figure 2.
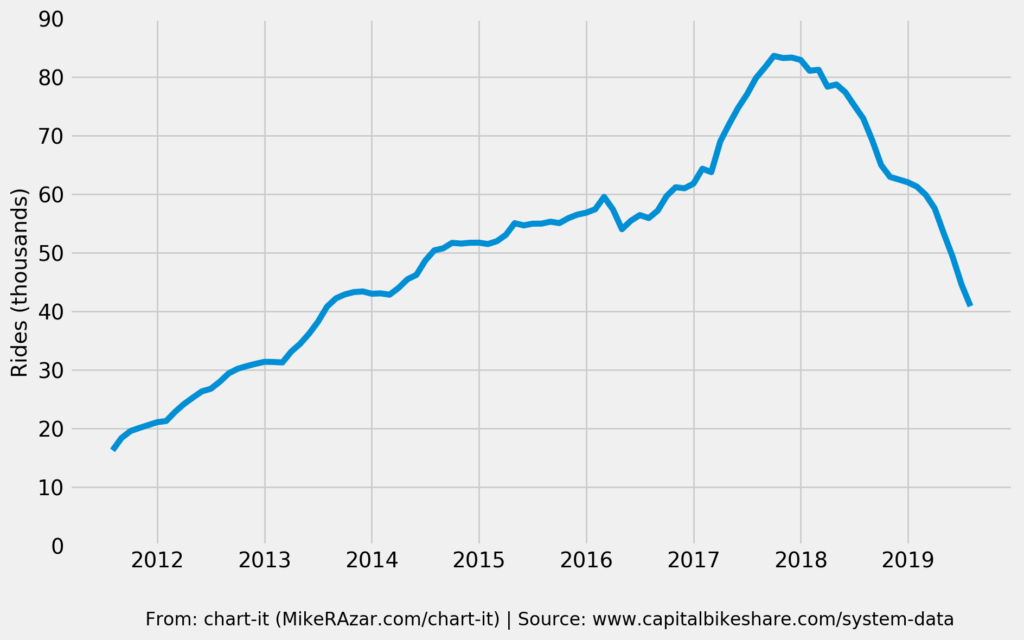
While ridership from Registered users continues to grow (albeit more slowly), Casual ridership has collapsed, falling from nearly 85,000 rides per month on average in 2017 to just more than 40,000 today. That’s a level not seen since 2013. Casual riders, it seems, have come to prefer alternative means of transportation within the District.
Figure 2. Average Monthly Rides (12m Rolling Average)
(Registered Members)
(Casual Members)
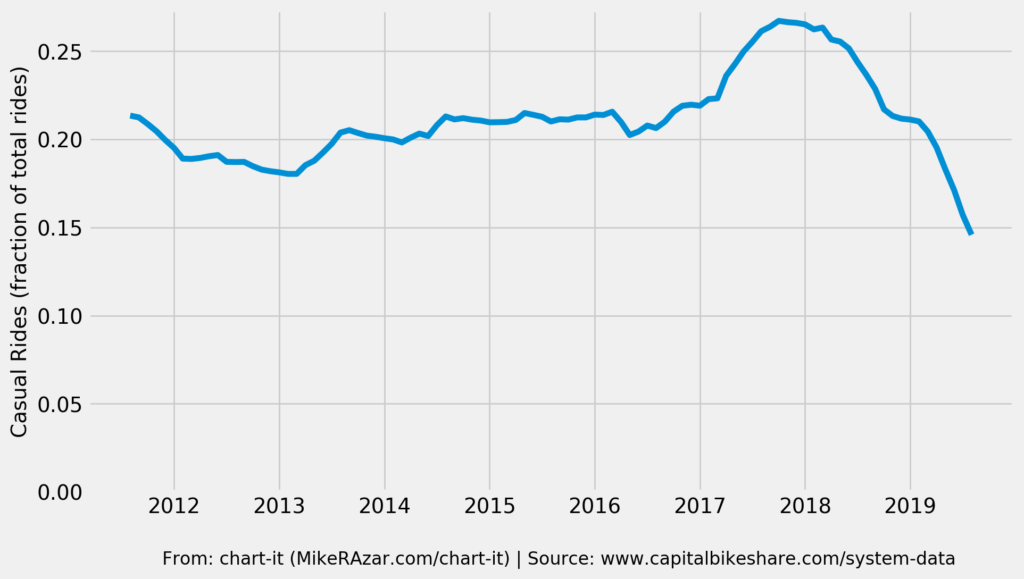
At its peak, Casual ridership comprised more than 26 percent of total ridership (Figure 3). Today, that has fallen to under 15 percent. It is interesting to note that the fall in Casual ridership followed an extraordinarily rapid growth between 2016 and 2017.
Figure 3. Casual Rides as a Fraction of Total Rides (12m Rolling Average)
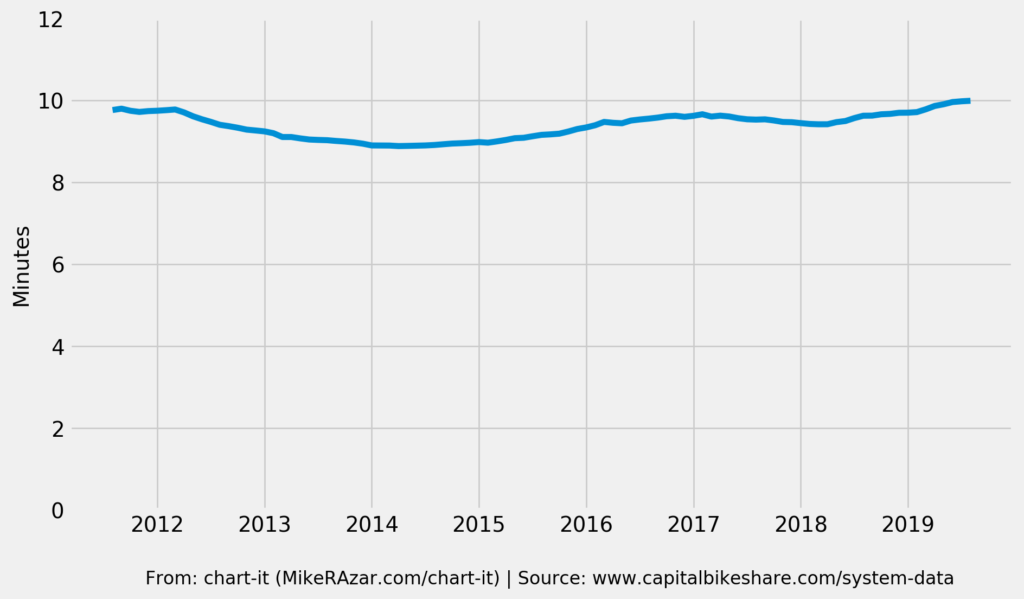
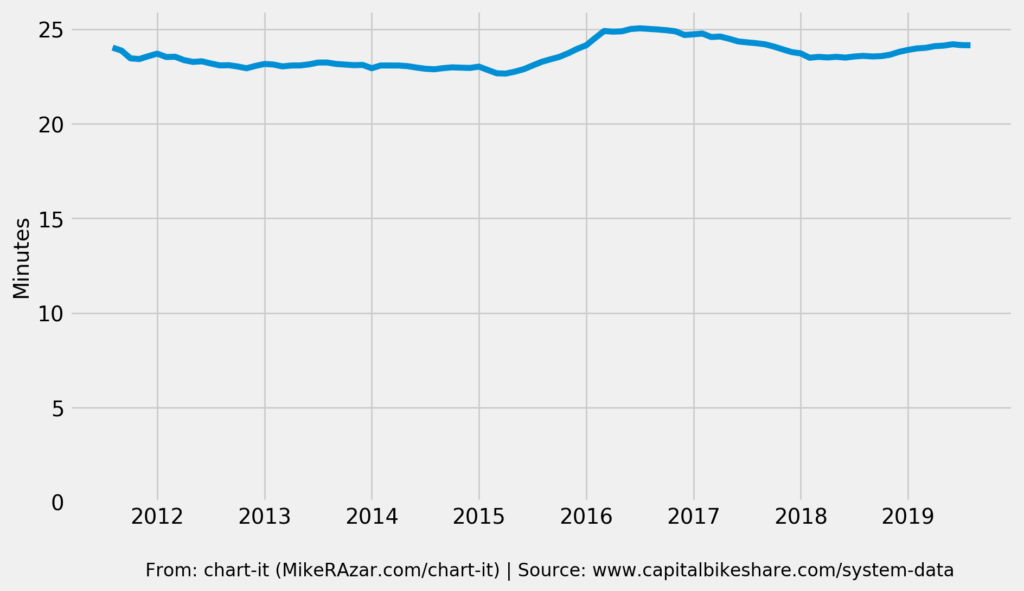
The average duration of a ride has been fairly consistent since 2010 between 9-10 minutes per ride for Registered riders and 23-25 minutes for Casual riders (Figure 4).
Figure 4. Median Ride Duration (12m Rolling Average)
(Registered Riders)
(Casual Riders)
Stations and Bikes
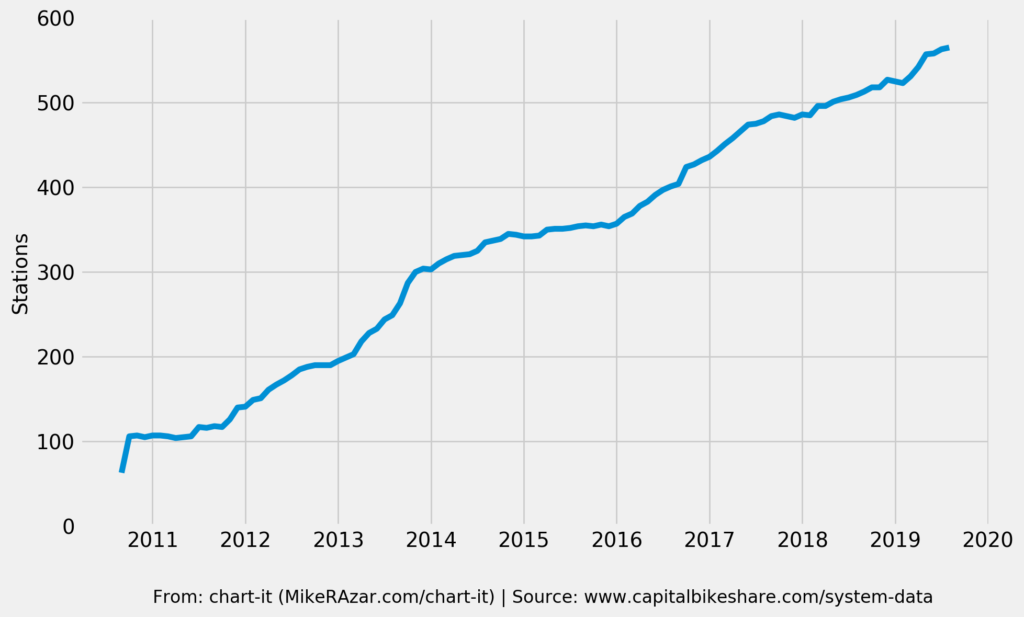
The number of stations expanded from less than 100 stations in 2010 to more than 550 today (Figure 5) and continues to grow despite slowing ridership in recent years. In fact, system expansion is currently around the nine-year average of about five new stations per month. This is consistent with Capital Bikeshare’s objective to expand the System’s footprint into lesser served communities, east of the Anacostia River, for example, and may explain the continued growth in Registered ridership shown in Figure 2 above. With Casual ridership around tourist destinations rapidly slowing, these new customers (DMV residents) may become Bikeshare’s primary source of growth in the future.
Figure 5. Number of Stations
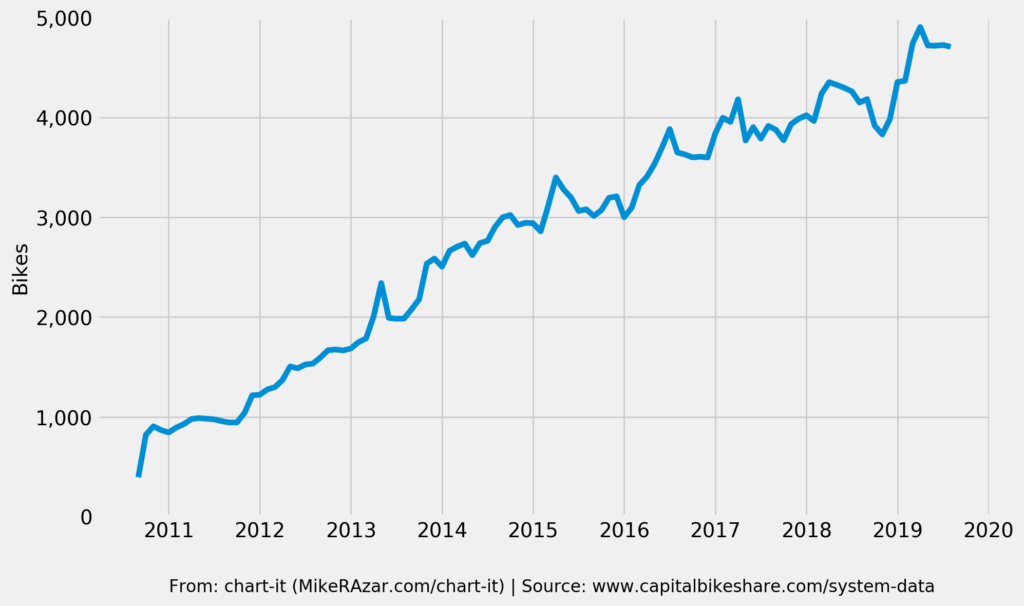
Similarly, the number of bikes has grown from under 500 to just around 5,000 (Figure 6). Currently, about 40 new bikes join the system per month, which is also right around the nine-year average growth rate.
Figure 6. Number of Bikes
Busiest Routes and Stations
Figure 7 below shows the busiest routes over the last nine years. The busiest is from “Jefferson Dr & 14th St NW” to…. “Jefferson Dr & 14th St NW”. This station is in the middle of the National Mall, a popular tourist destination, so I suppose it’s not surprising if you consider that tourists will hop on a bike, ride around the Mall, and then drop it off from where they picked it up. The top five most popular routes are all among stations in tourist hotspots. This is indicative of the geographic concentration of rides by Casual users.
Figure 7. Busiest Routes
| Starting Station | Ending Station |
|---|---|
| Jefferson Dr & 14th St SW | Jefferson Dr & 14th St SW |
| Lincoln Memorial | Jefferson Memorial |
| Jefferson Dr & 14th St SW | Lincoln Memorial |
| Lincoln Memorial | Jefferson Dr & 14th St SW |
| Ohio Dr & West Basin Dr SW / MLK & FDR Memorials | Ohio Dr & West Basin Dr SW / MLK & FDR Memorials |
Among Registered riders (Figure 8 below), the most popular route is from “Eastern Market Metro” to “Lincoln Park” (the reverse route is the second most popular). “Columbus Circle” to “8th & F St NE” is the third most popular. This is generally consistent with the results of our analysis of the busiest routes in 2015, so not much has changed since then (see Part 3 of our series).
Figure 8. Busiest Routes by Registered Members
| Starting Station | Ending Station |
|---|---|
| Eastern Market Metro / Pennsylvania Ave & 7th St SE | Lincoln Park / 13th & East Capitol St NE |
| Lincoln Park / 13th & East Capitol St NE | Eastern Market Metro / Pennsylvania Ave & 7th St SE |
| Columbus Circle / Union Station | 8th & F St NE |
| Adams Mill & Columbia Rd NW | Calvert St & Woodley Pl NW |
| 8th & F St NE | Columbus Circle / Union Station |
Overall, the busiest stations (measured by number of rides starting or ending from there) are “Columbus Circle” followed by “Massachusetts Ave & Dupont Circle NW”, “Lincoln Memorial”, “Jefferson Drive & 14th St SW”, and “15th & P St NW.”
So congratulations to Capital Bikeshare’s busiest stations over the last nine years: “Columbus Circle” among Registered riders and “Jefferson Dr & 14th St NW” among Casual riders.
Bike Workload
As anyone who has ridden a Bikeshare bike can attest to, those things are tanks. They can really take a beating. Nevertheless, bikes do age and need to be replaced from time to time. So how has Capital Bikeshare managed the aging of its fleet? Let’s take a look at the average age of a Bikeshare bike. (This analysis assumes that Capital Bikeshare does not recycle Bike serial numbers, in which case, it would not be possible to measure the average bike age with the public system data.)
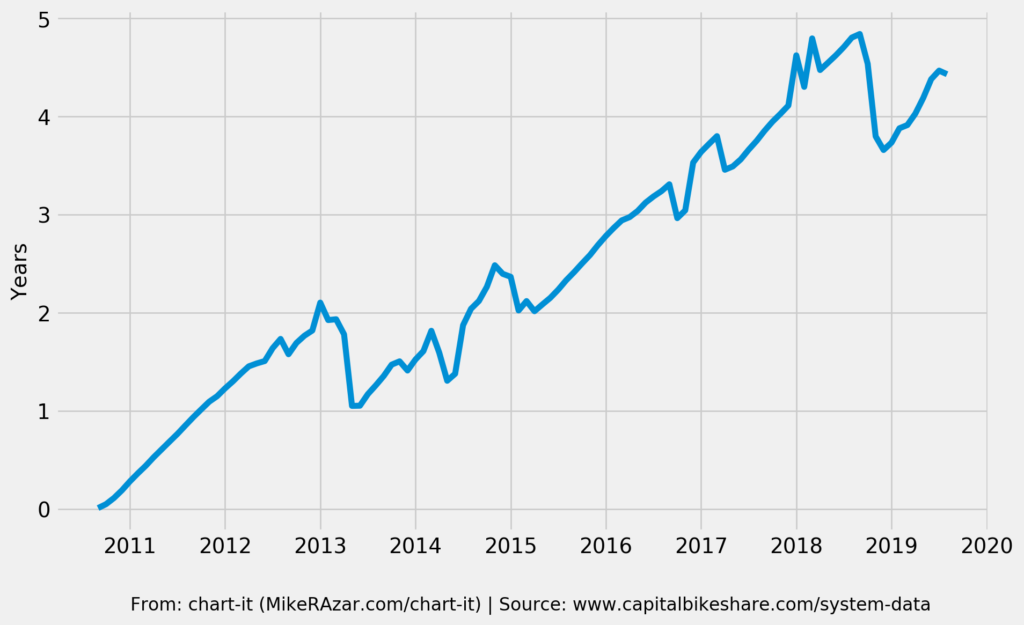
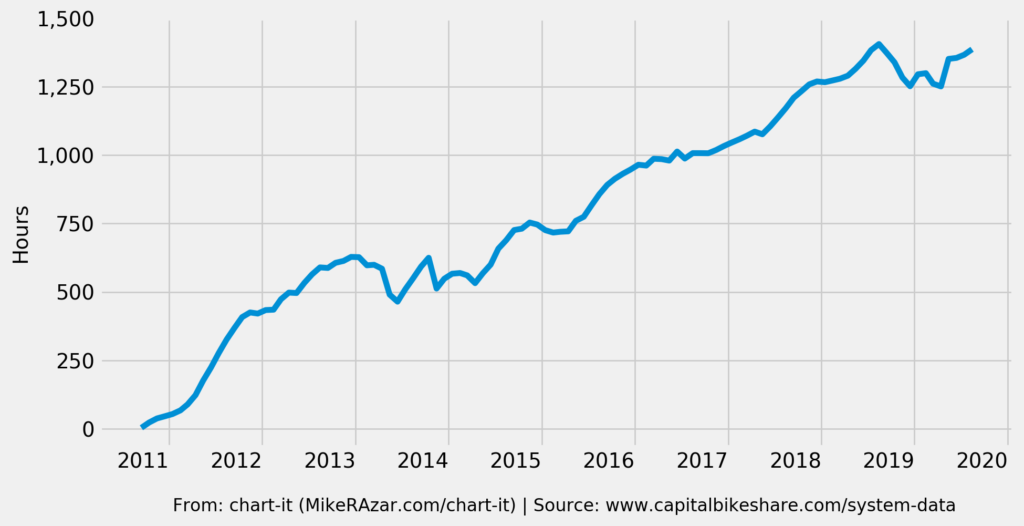
The median age of a bike currently in service is about 4.5 years (Figure 9). Measured in terms of total ride time, that’s about 1,400 hours. The median age of bikes in the fleet has been relatively flat after peaking in 2018, indicating that Capital Bikeshare has made an effort in recent years to replace aging bikes. The lifespan of a Bikeshare bike is 3-5 years according to the “Institute for Transportation and Development Policy”. The data indicates that more than half of the bikes in the Capital Bikeshare fleet are running well passed their suggested lifespan.
Figure 9. Median Age of a Bike in Bikeshare’s Fleet
(Measured in Years of Service)
(Measured in Ride Hours)
One bike, in particular, has been very busy. The busiest bike since the System’s inception is #W00307, which entered service in 2010 and is, remarkably, still active in the fleet, making it nine years old! It’s recorded more than 191,146 minutes of service (3,186 hours) over 8,306 rides. The next busiest bike is far behind at just under 180,000 minutes.
Congratulations to Bike #W00307 for its unwavering work ethic.
When the Bikeshare system was introduced in 2010, it revolutionized transportation in the District for residents like me. It was, at the time, a cutting edge and first-of-its-kind system. The DMV governments, Capital Bikeshare, and all who helped plan and roll out the system over the last nine years deserve a ton of credit for their vision and hard work. Thank you.
Mike, thanks for this excellent research.
I’m glad you enjoyed it! Thanks for reading.
I’d be curious to see breakdowns of station growth and bike growth by much more granular geographies.