Capital Bikeshare, the DMV area’s bikesharing system, has exploded in popularity since it was first implemented in 2010. The sight of bright red bike-tanks docked in bike racks that have sprung up all over DC during the last few years is hard to miss. While I am a huge fan of bikesharing systems, I am an even bigger fan of the large amount of system data that Capital Bikeshare makes available on their website. Data on every ride (anonymously, of course) is provided, including starting and ending location, duration of the ride, bike number, and member type (registered or day/casual user). This post is the first of a four-part series that will explore this dataset, which comprises tens of millions of data points from nearly 10 million bike rides. The series will cover:
- Part 1 explores the riding patterns of Bikeshare members in 2014.
- Part 2 looks at bike activity and workload patterns in 2014.
- Part 3 explores popular routes and stations in during the year ending June 2015.
- Part 4 will explore trends over the period from 2010 to the first half of 2015.
The Capital Bikeshare system data can be found here. The source code for the data analysis can be found here.
History of the Capital Bikeshare System
Capital Bikeshare was founded in 2010 by Arlington and the District of Columbia. The system, now comprising more than 300 stations and 2,500+ bikes, has grown to include two additional jurisdictions, Alexandria and Montgomery County. The Capital Bikeshare system is owned by the participating jurisdictions and is operated by Motivate, a Brooklyn, NY-based company that operates several other bikesharing systems including Citibike in New York City, Hubway in Boston and Divvy Bikes in Chicago.
General System Summary
In 2014, Capital Bikeshare logged more than 2.9 million bike rides with a combined duration of 50 million minutes. That’s about 96 years of bike rides. While registered members (i.e., members with an annual membership) made up 79% of total rides, they only made up 53% of total minutes ridden. That is because registered members took rides that were, on average, 61% shorter than rides taken by casual members. Not surprisingly, us locals are stricter about keeping to the 30 minute free-ride limit.
Figure 1. System Summary Statistics
| All Riders | Registered | Casual | |
|---|---|---|---|
| Number of Rides (#) | 2,946,921 | 2,326,215 | 620,706 |
| Total Minutes Ridden (mins) | 50,401,730 | 26,679,639 | 23,722,090 |
| Mean Ride Duration (mins) | 17.1 | 11.5 | 38.2 |
| Median Ride Duration (mins) | 10.8 | 9.1 | 23.4 |
| Standard Deviation of Ride Duration (mins) | 30 | 17.4 | 50.7 |
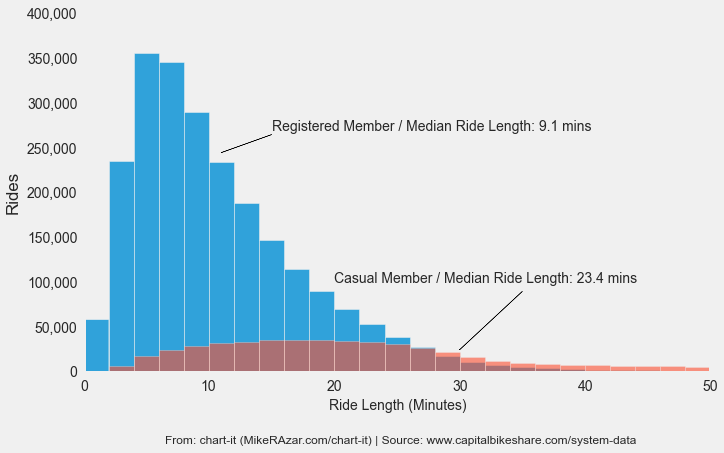
Ride Duration Frequency
Rides by registered members are more tightly clustered around shorter trips compared to rides by casual members, which are more widely distributed. This is reflected in the pattern of the histogram below and in the significantly higher standard deviation of ride duration for casual members compared to registered members. In other words, registered riders consistently take shorter trips, while casual riders take trips whose duration varies to a greater extent.
Capital Bikeshare charges an additional fee for rides that exceed 30 minutes. This fee did not apply to the vast majority of rides as just 35% of rides by casual members were longer than 30 minutes, compared to less than 3% for registered members. In aggregate, about 9% of total rides were longer than 30 minutes. Maybe the 30 minute threshold should be shortened… for casual members?
Figure 2. Ride Duration Frequency
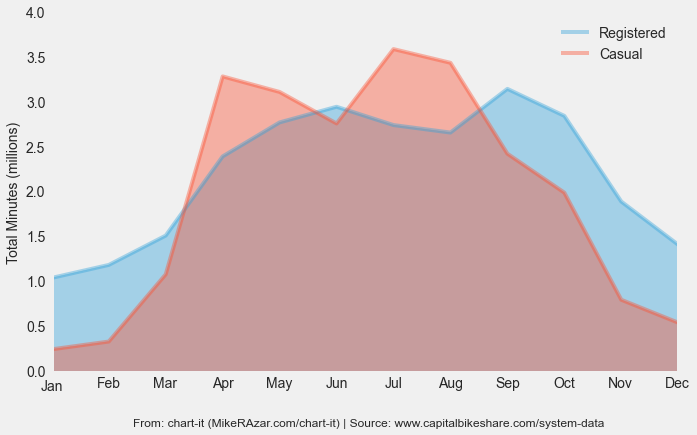
Monthly Patterns
The bikeshare system data reflects interesting monthly patterns. The system is busiest from the spring through the fall. The shoulder months are November-February for both casual and registered members. The peak in total minutes for casual riders is July, whereas it’s September for registered riders. Casual ridership seems to peak twice, once in April and again in July. This may reflect cherry blossom season in April and then the mid-summer tourist season in July. As mentioned previously, there is a roughly even split in total minutes between casual and registered riders. Casual riders have the slight advantage during the spring and summer months, while registered riders have the advantage during the fall and winter months. Registered rider minutes peak in September, probably reflecting the rush to enjoy as much time outside before winter.
Figure 3. Total Minutes Ridden
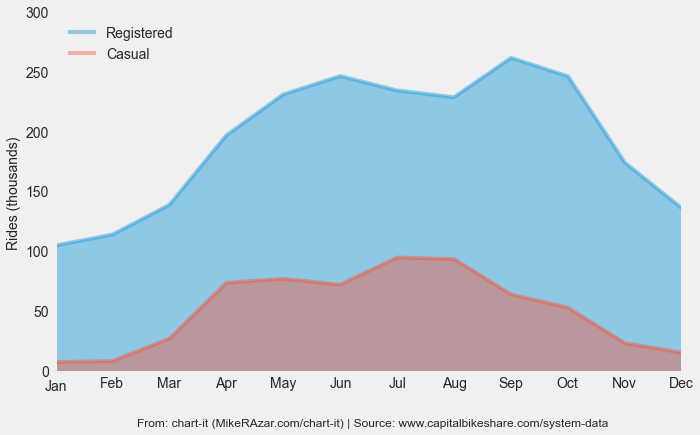
The number of rides per month exhibit a similar pattern as total minutes ridden, except that the number of rides taken by registered members is overwhelmingly greater than the number of rides taken by casual members in every month.
Another interesting observation is the significant difference between the busiest and the least busy months. For registered members, there are as little as 106,000 rides in the least busy month (January) compared to as many as 263,000 rides in the busiest month (September), a 2.5x increase. For casual members, there are as little as a few 8,300 rides in the least busy month (January) compared to nearly 96,000 rides in the busiest month (July), an 11.6x increase!
Figure 4. Number of Rides
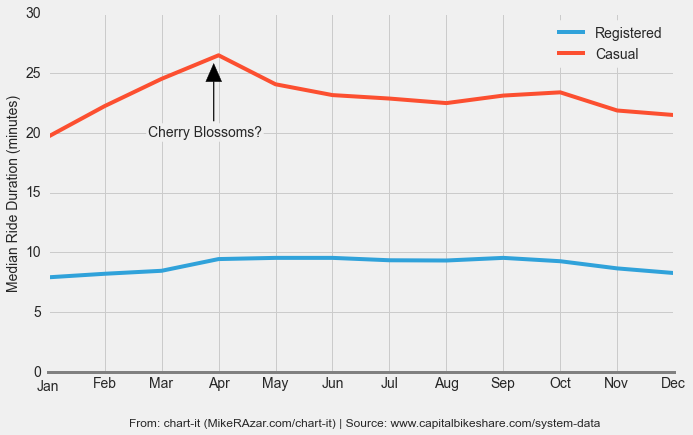
The median ride duration for registered users is generally flat across every month. For casual members, there is a spike in April (following month-to-month increases starting in January), probably a result of the influx of cherry blossom tourists who descend on DC every April. The median ride duration for casual riders does not exhibit a double-peak as does the data for total rides and total minutes ridden.
Figure 5. Median Ride Duration
Longest and Shortest Rides
While most Capital Bikeshare rides are less than 30 minutes in duration, some rides are extremely long. The 100 longest rides of 2014 averaged upwards of 22.5 hours (and cost around $100). Casual members accounted for 78 of the top 100 longest rides. Perhaps they either did not dock their bike properly or lost it/had it stolen.
Figure 6. Longest Rides Summary Statistics
| All Riders | Registered | Casual | |
|---|---|---|---|
| Number of Rides (#) | 100 | 22 | 78 |
| Total Minutes Ridden (mins) | 138,241 | 30,152 | 108,089 |
| Mean Ride Duration (mins) | 1,382 | 1,371 | 1,386 |
| Median Ride Duration (mins) | 1,386 | 1,368 | 1,388 |
On the opposite end of the spectrum are the extremely short rides. There were 32,328 rides shorter than one minute in 2014 (about 1.1% of total rides). These likely reflect bikes that were returned immediately because of issues with the bike. More than 99% of these were logged by registered users, who appear to have a higher standard when selecting a bike (or just notice a bad bike quicker).
Of the 32,328 short rides, 291 were for a full zero minutes. It’s not clear how a user would register a zero minute ride in the first place as a bike returned immediately would still register a small fraction of a minute. This could be an error in the data set.
Check out part two of this series where chart-it explores bike activity and workload patterns in 2014 (including an award for ‘most hardworking bike’)!
Differentiating between casual and registered users made for a revealing study. Aggregate figures for DC seem large but would probably pale in comparison to NYC. Would be interesting to see such city comparisons.
Capital Bikeshare might actually be more popular than Citi Bikeshare. Interesting idea though. I'll look into doing a comparison after this series is finished.
Is it possible to figure out which dock is most likely to be blocked?
That information might come out of the analysis for part 3 on station/route data. I'll keep that question in mind when preparing that post. Thanks.